Logs
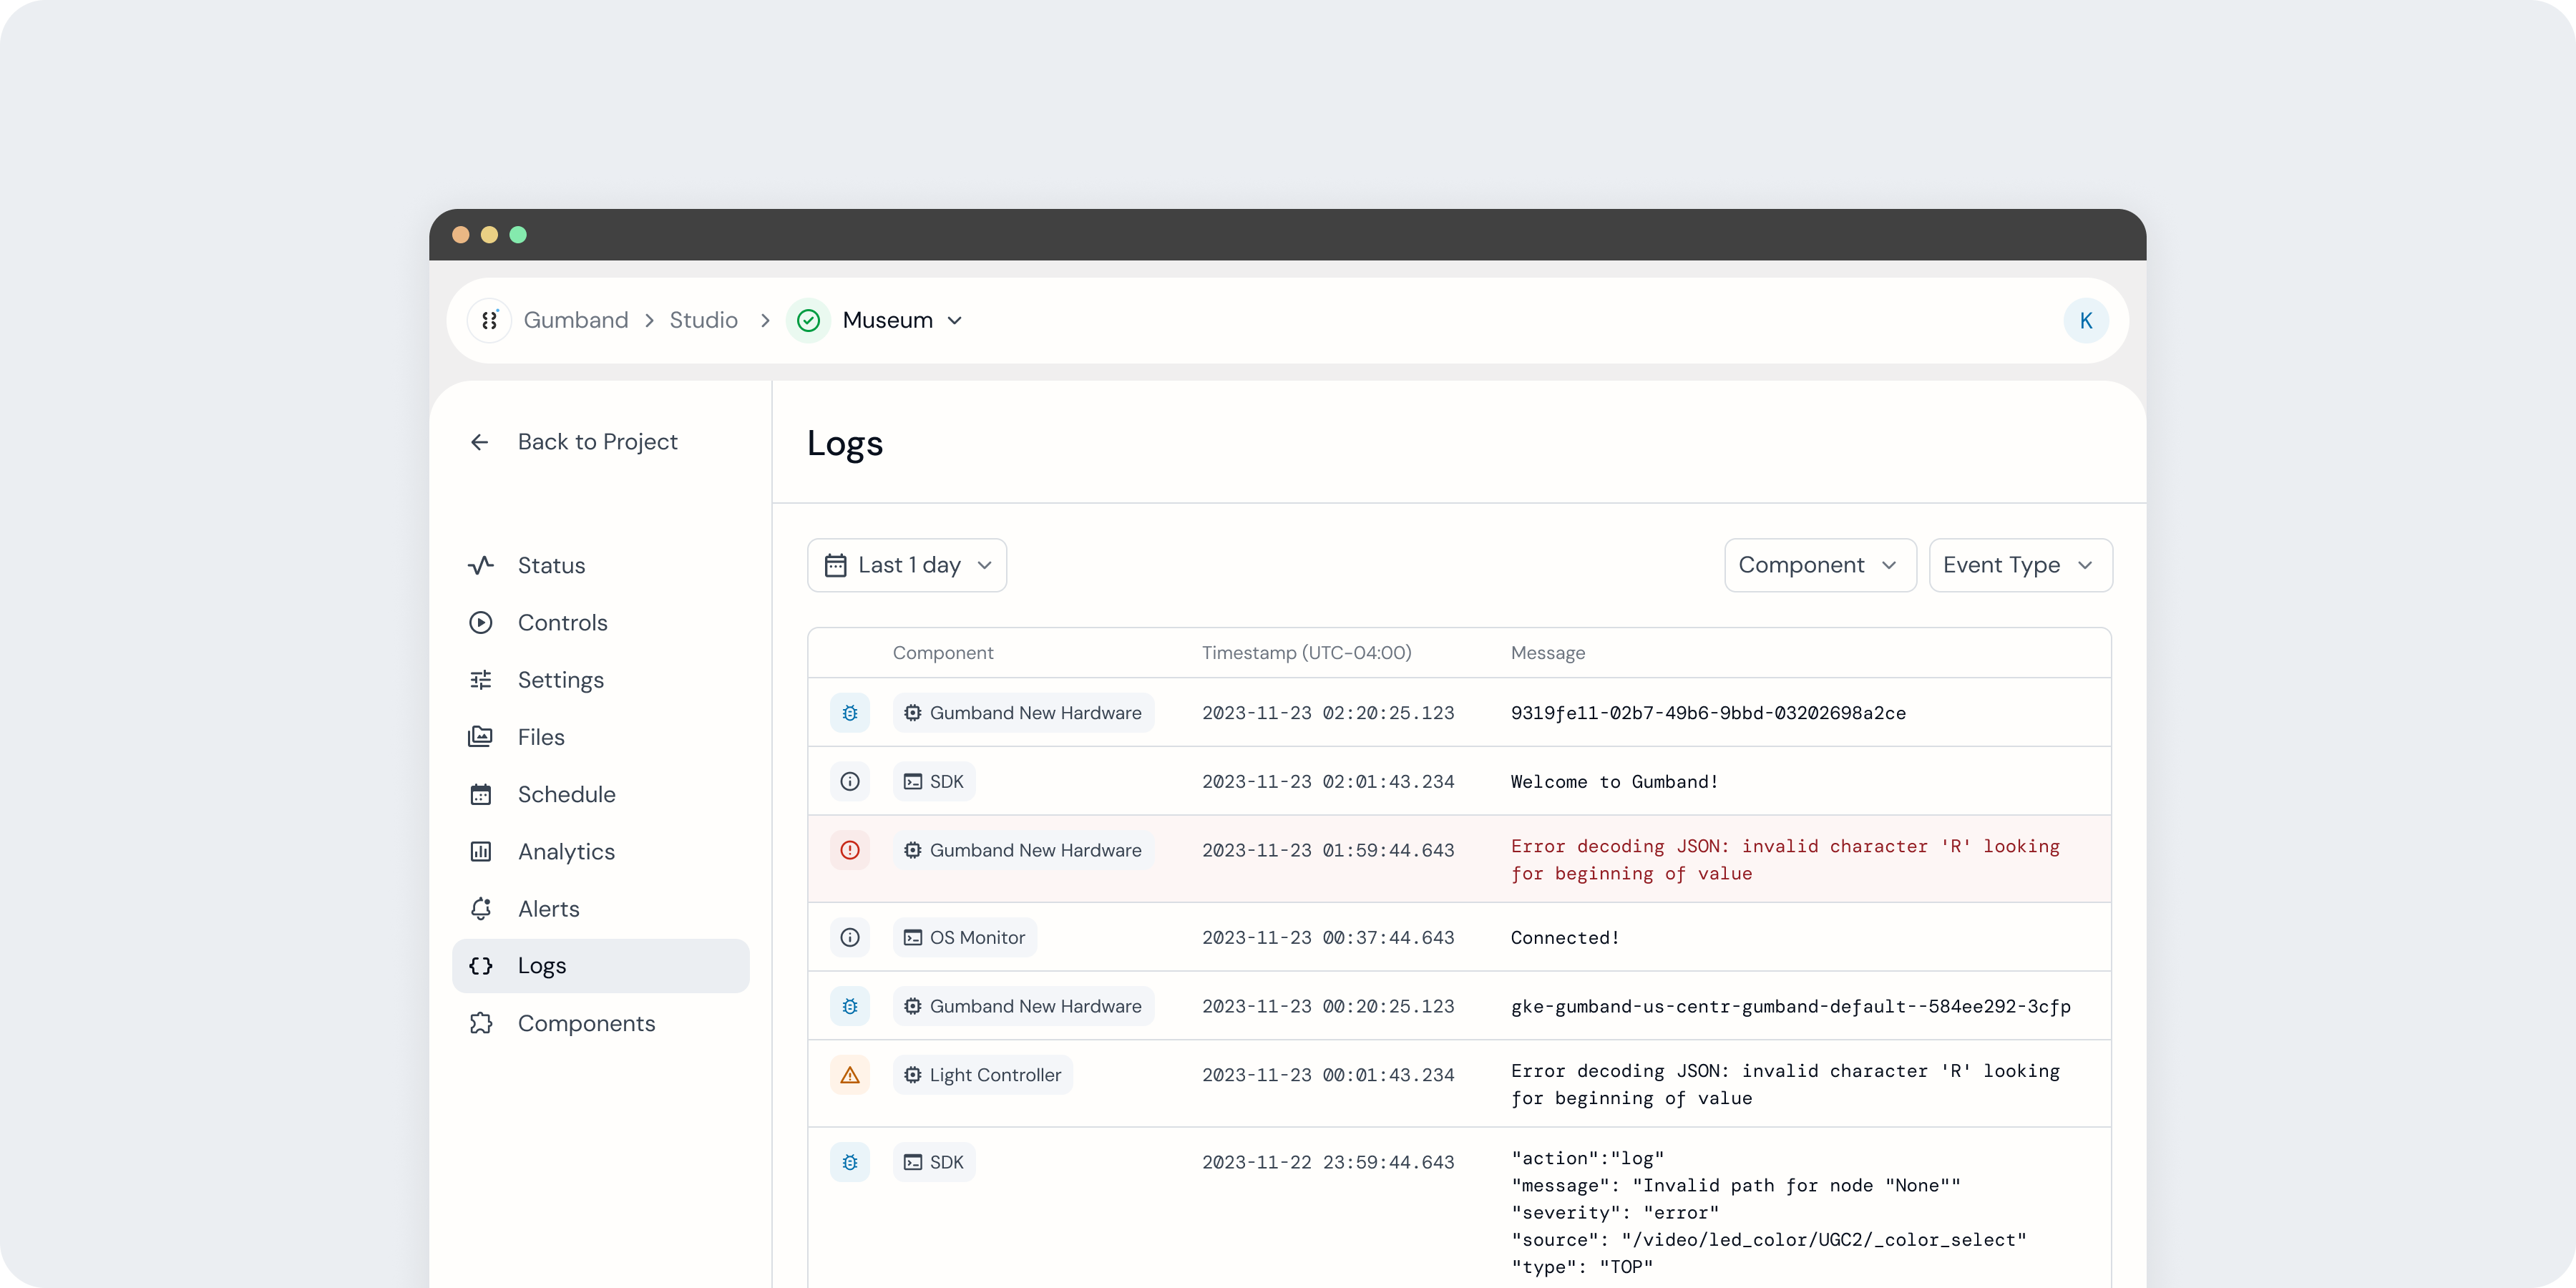 An exhibit’s Logs page in the Gumband UI.
The Logs page allows you to view all log messages sent by your exhibit’s components. Logs are used to provide granular, real-time information about how your exhibit is functioning, indicate errors should any issue arise, and surface critical debugging data.
The Logs page features a table to view log messages, as well as controls to filter down the table’s selection by date, type, and component.
Logs Table
The Logs table includes four columns: event type, component, timestamp, and message.
Event Type
A log’s event type—also known as log level—categorizes messages based on purpose and urgency.
- Error: Signals urgent issues that could impact exhibit functionality.
- Warning: Signals an unexpected state that may not cause failure but could require attention.
- Info: Provides general operational insights without indicating an issue.
- Debug: The least urgent level, surfacing detailed data that can help developers diagnose issues.
Each log level has a different retention period in order to minimize storage while making sure that the most critical issues remain accessible for the longest time.
- Error logs are retained indefinitely.
- Warning logs are retained for one week.
- Info logs are retained for 72 hours.
- Debug logs are retained for 48 hours.
Component
Component indicates the source component producing each log message. See the Component page for more information about the components connected to your exhibit.
Timestamp
The date and time at which the log was sent.
Message
The message body of the log.
Filters

By default, the Logs table will surface all available logs. Using controls above the table, you may filter displayed logs by date, type, and component.
Filter by Date and Time
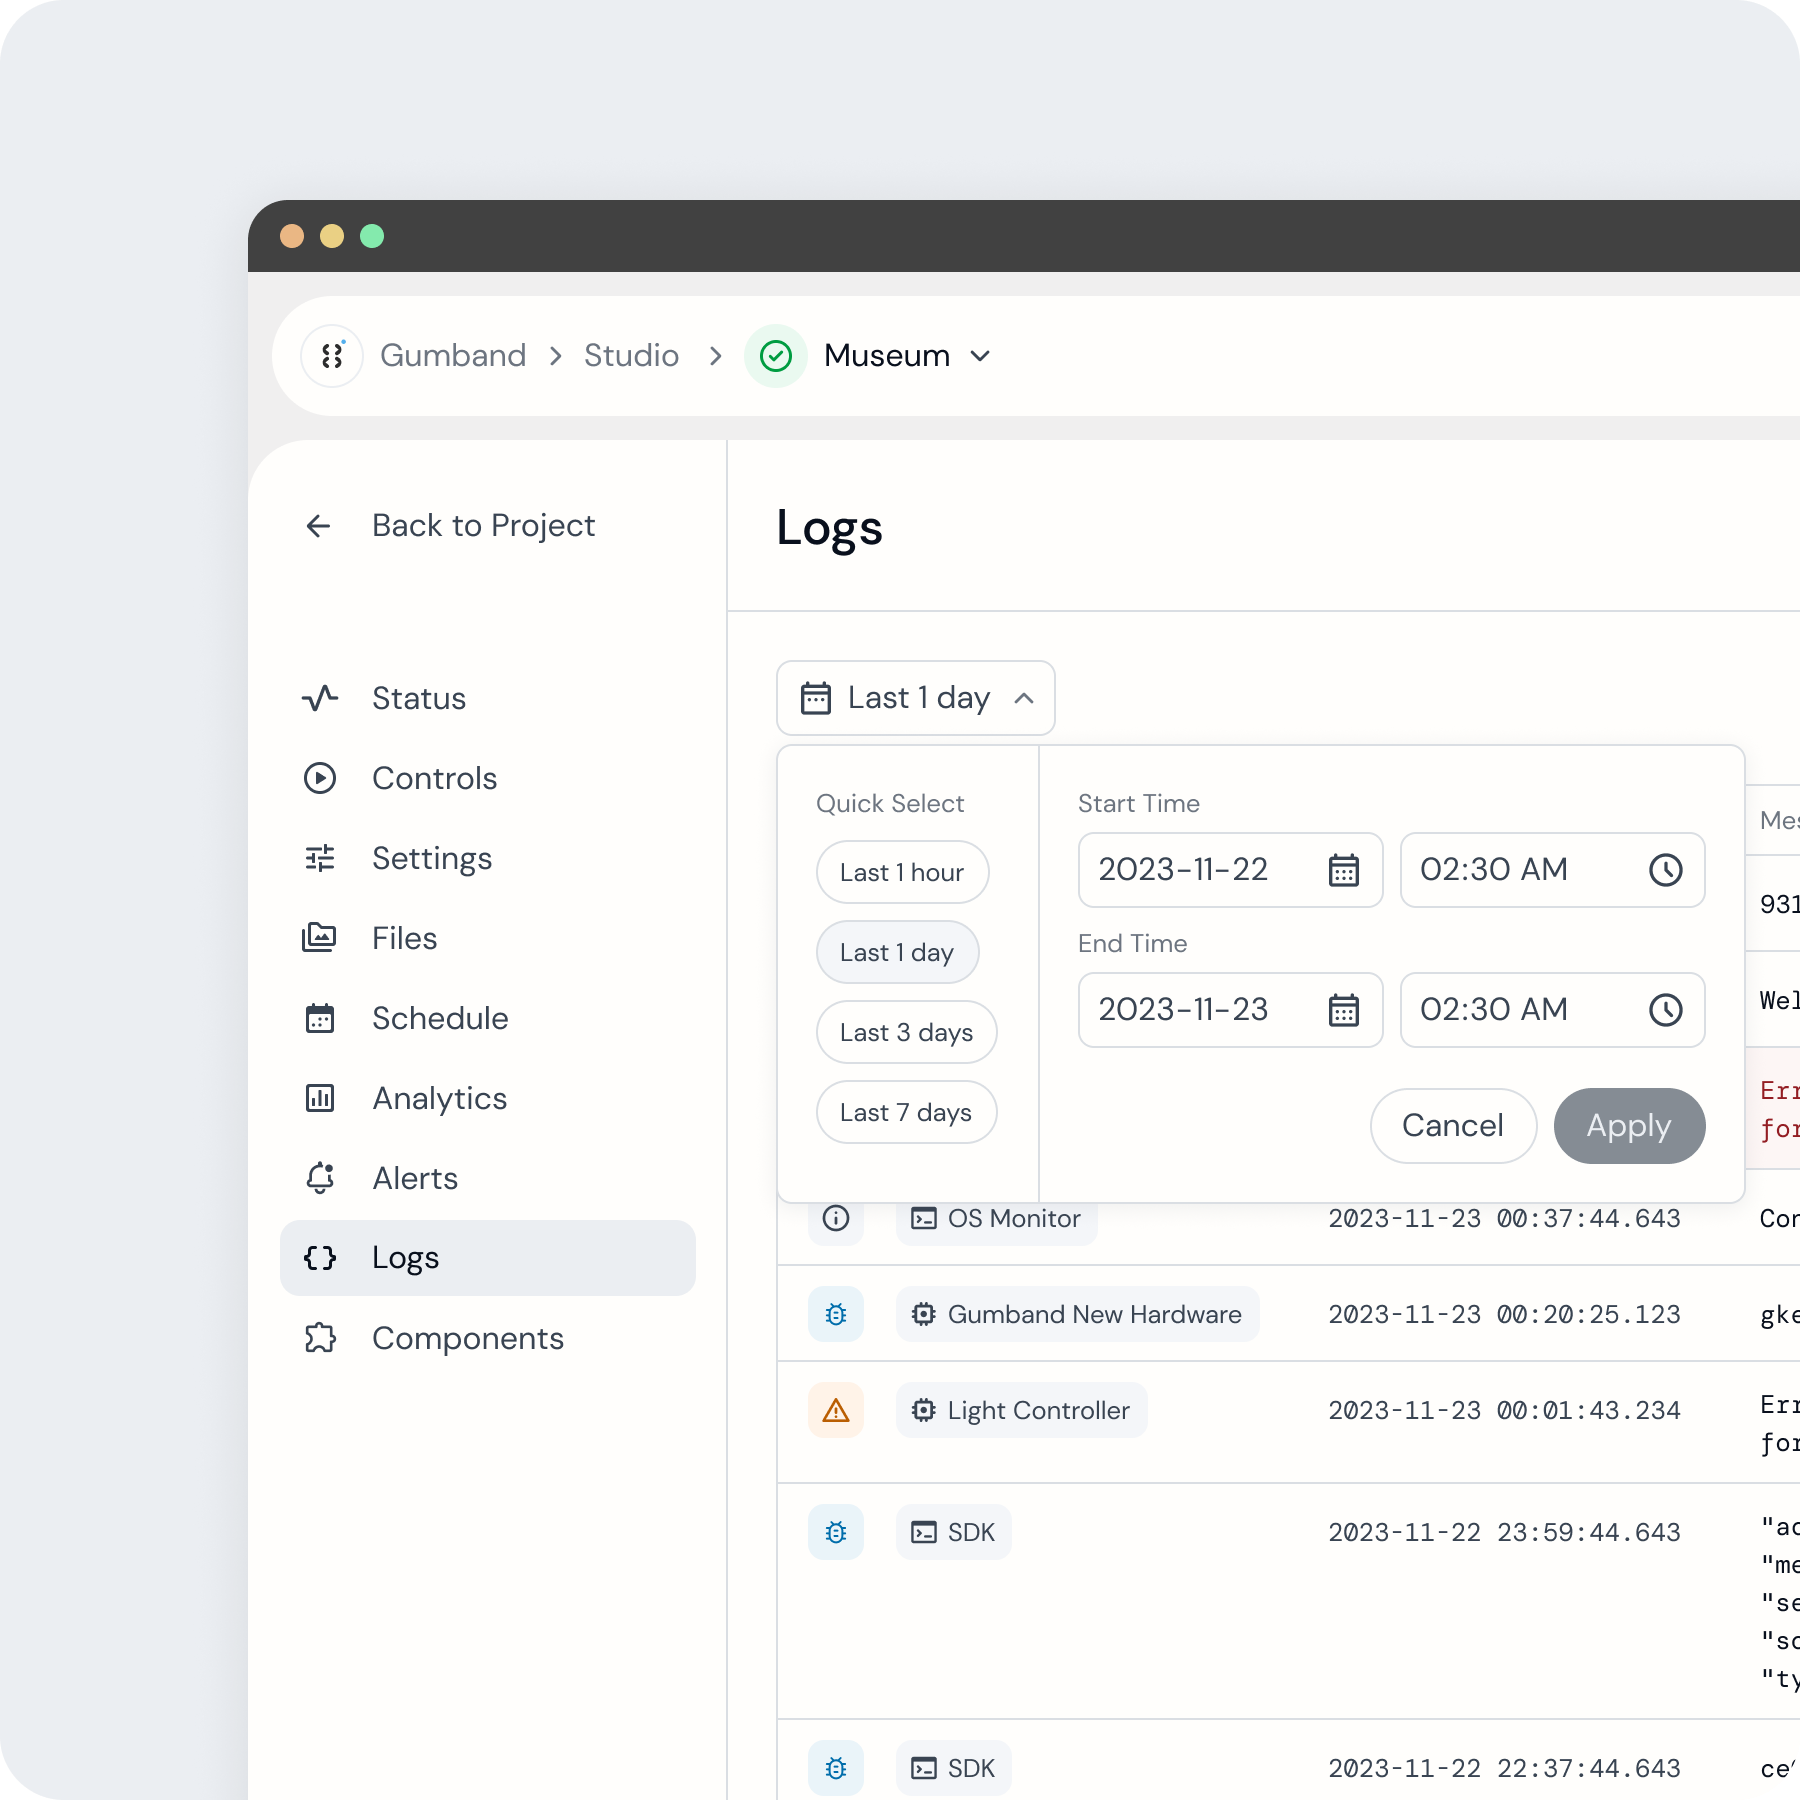 The date range picker used to filter an exhibit’s logs.
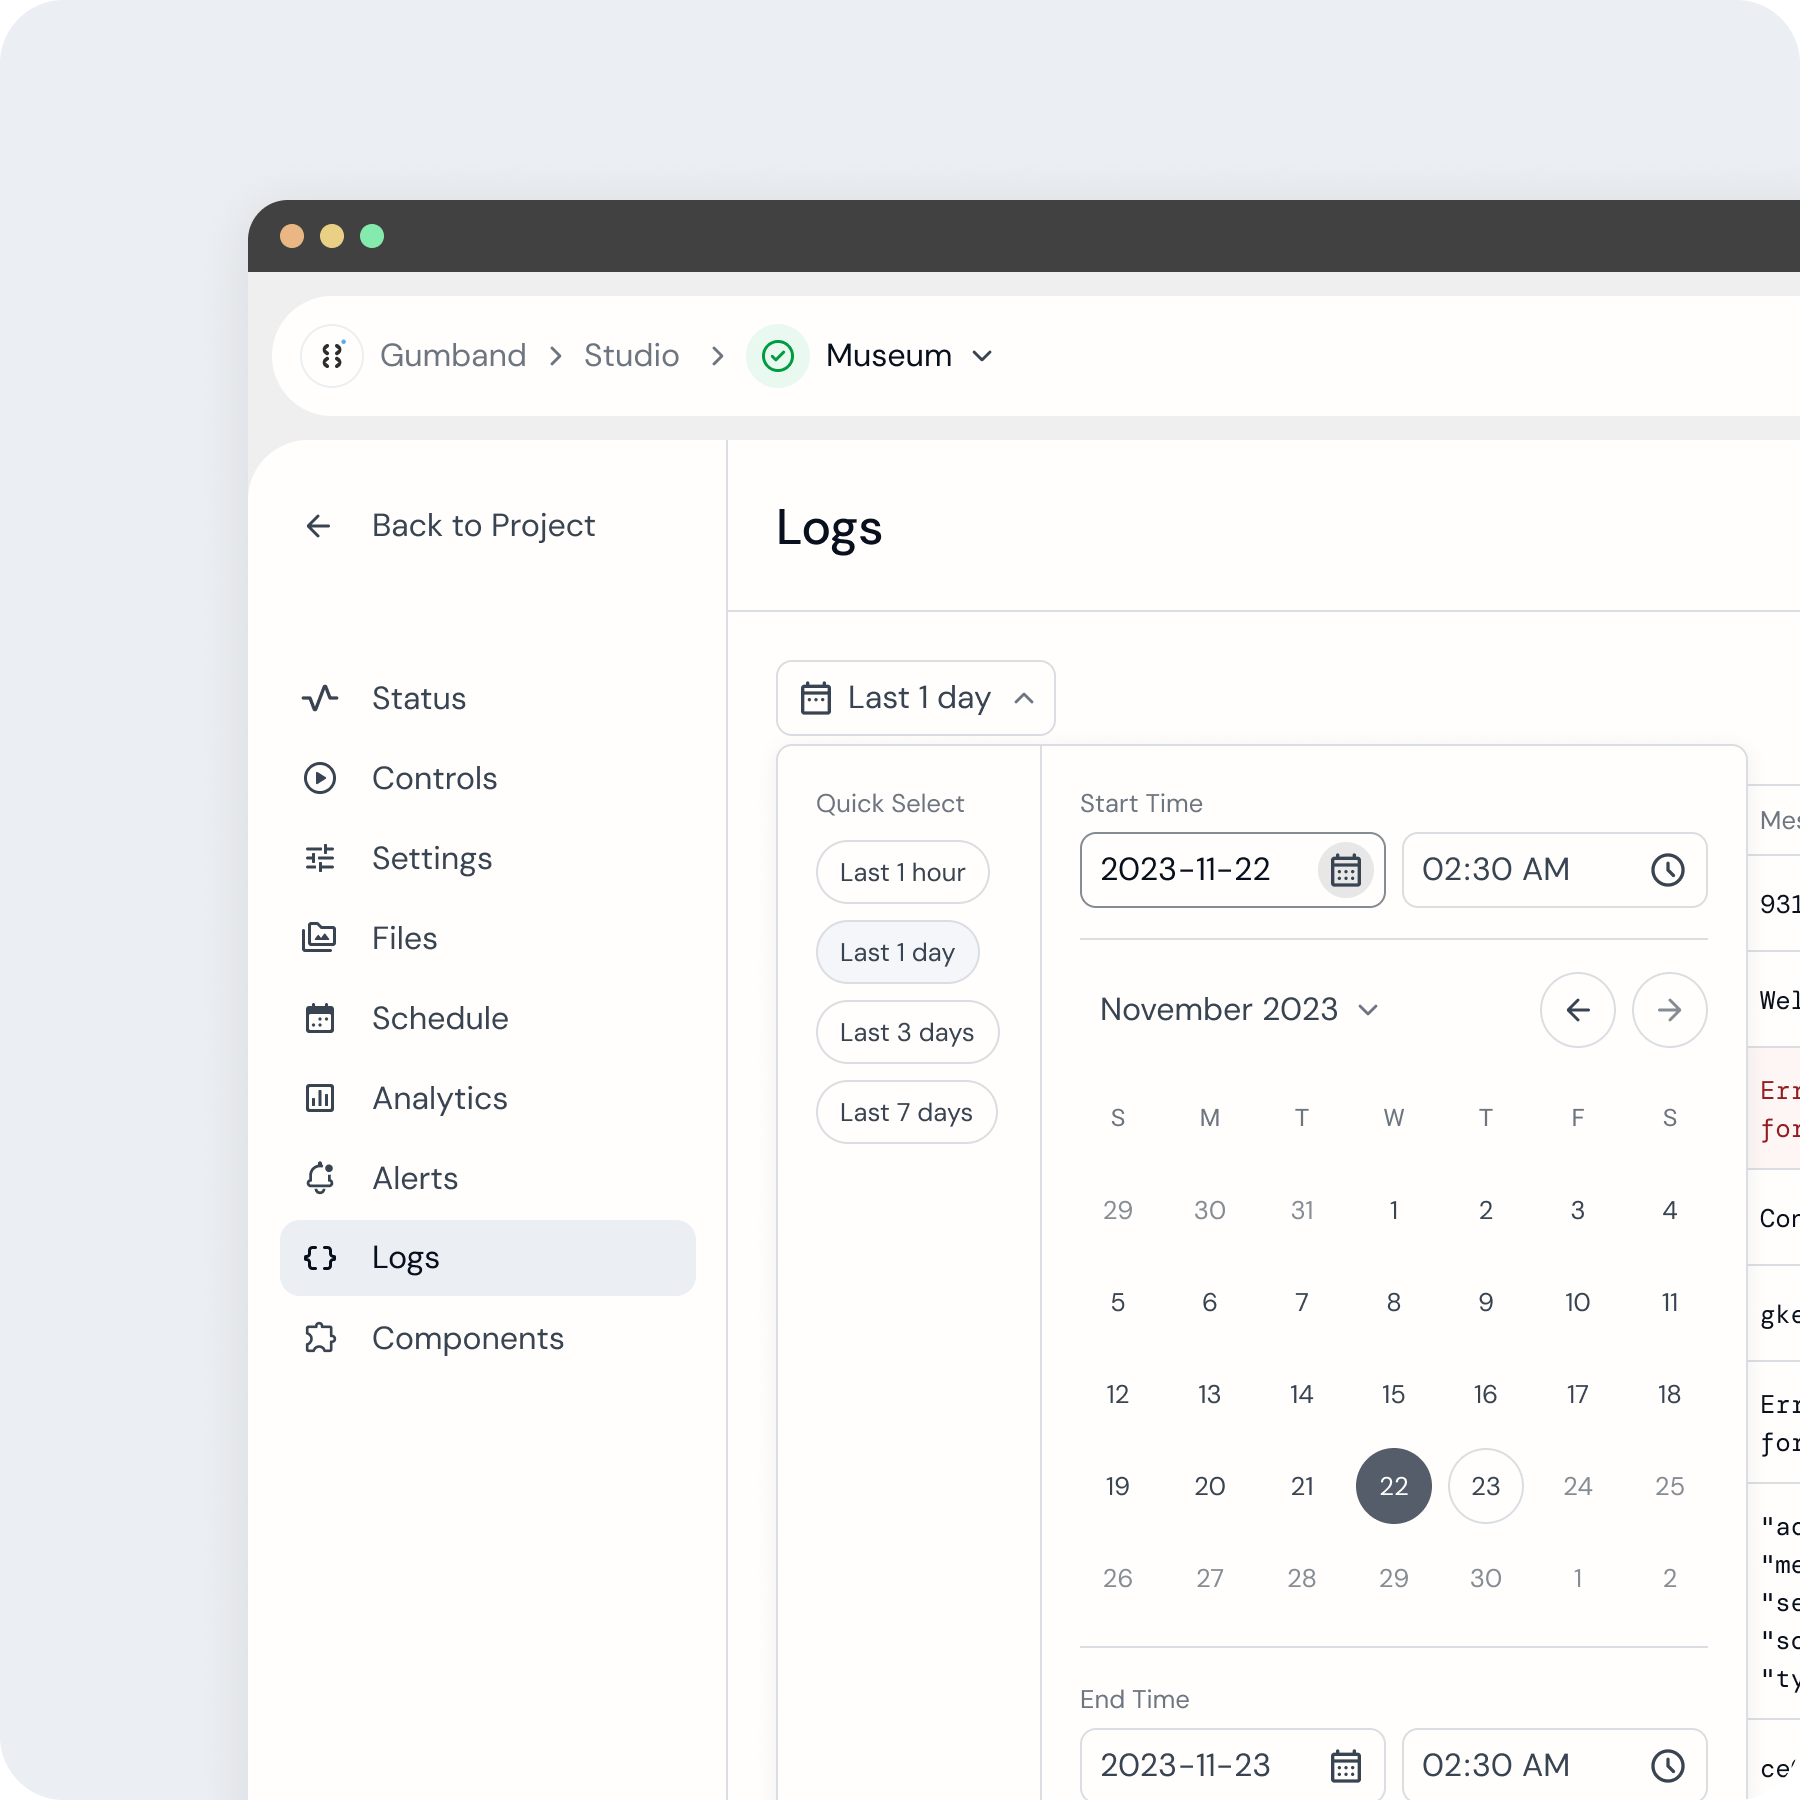 Date selection within the Logs page date picker.
To filter logs by date and time, select the input above the table’s left-hand side. This will open a date range picker where you may select a start date, start time, end date, and end time for your filter. You may select dates as far back as when the exhibit was instantiated in Gumband. There also are quick select options including the last hour, day, three days, and week of logs.
Filter by Component
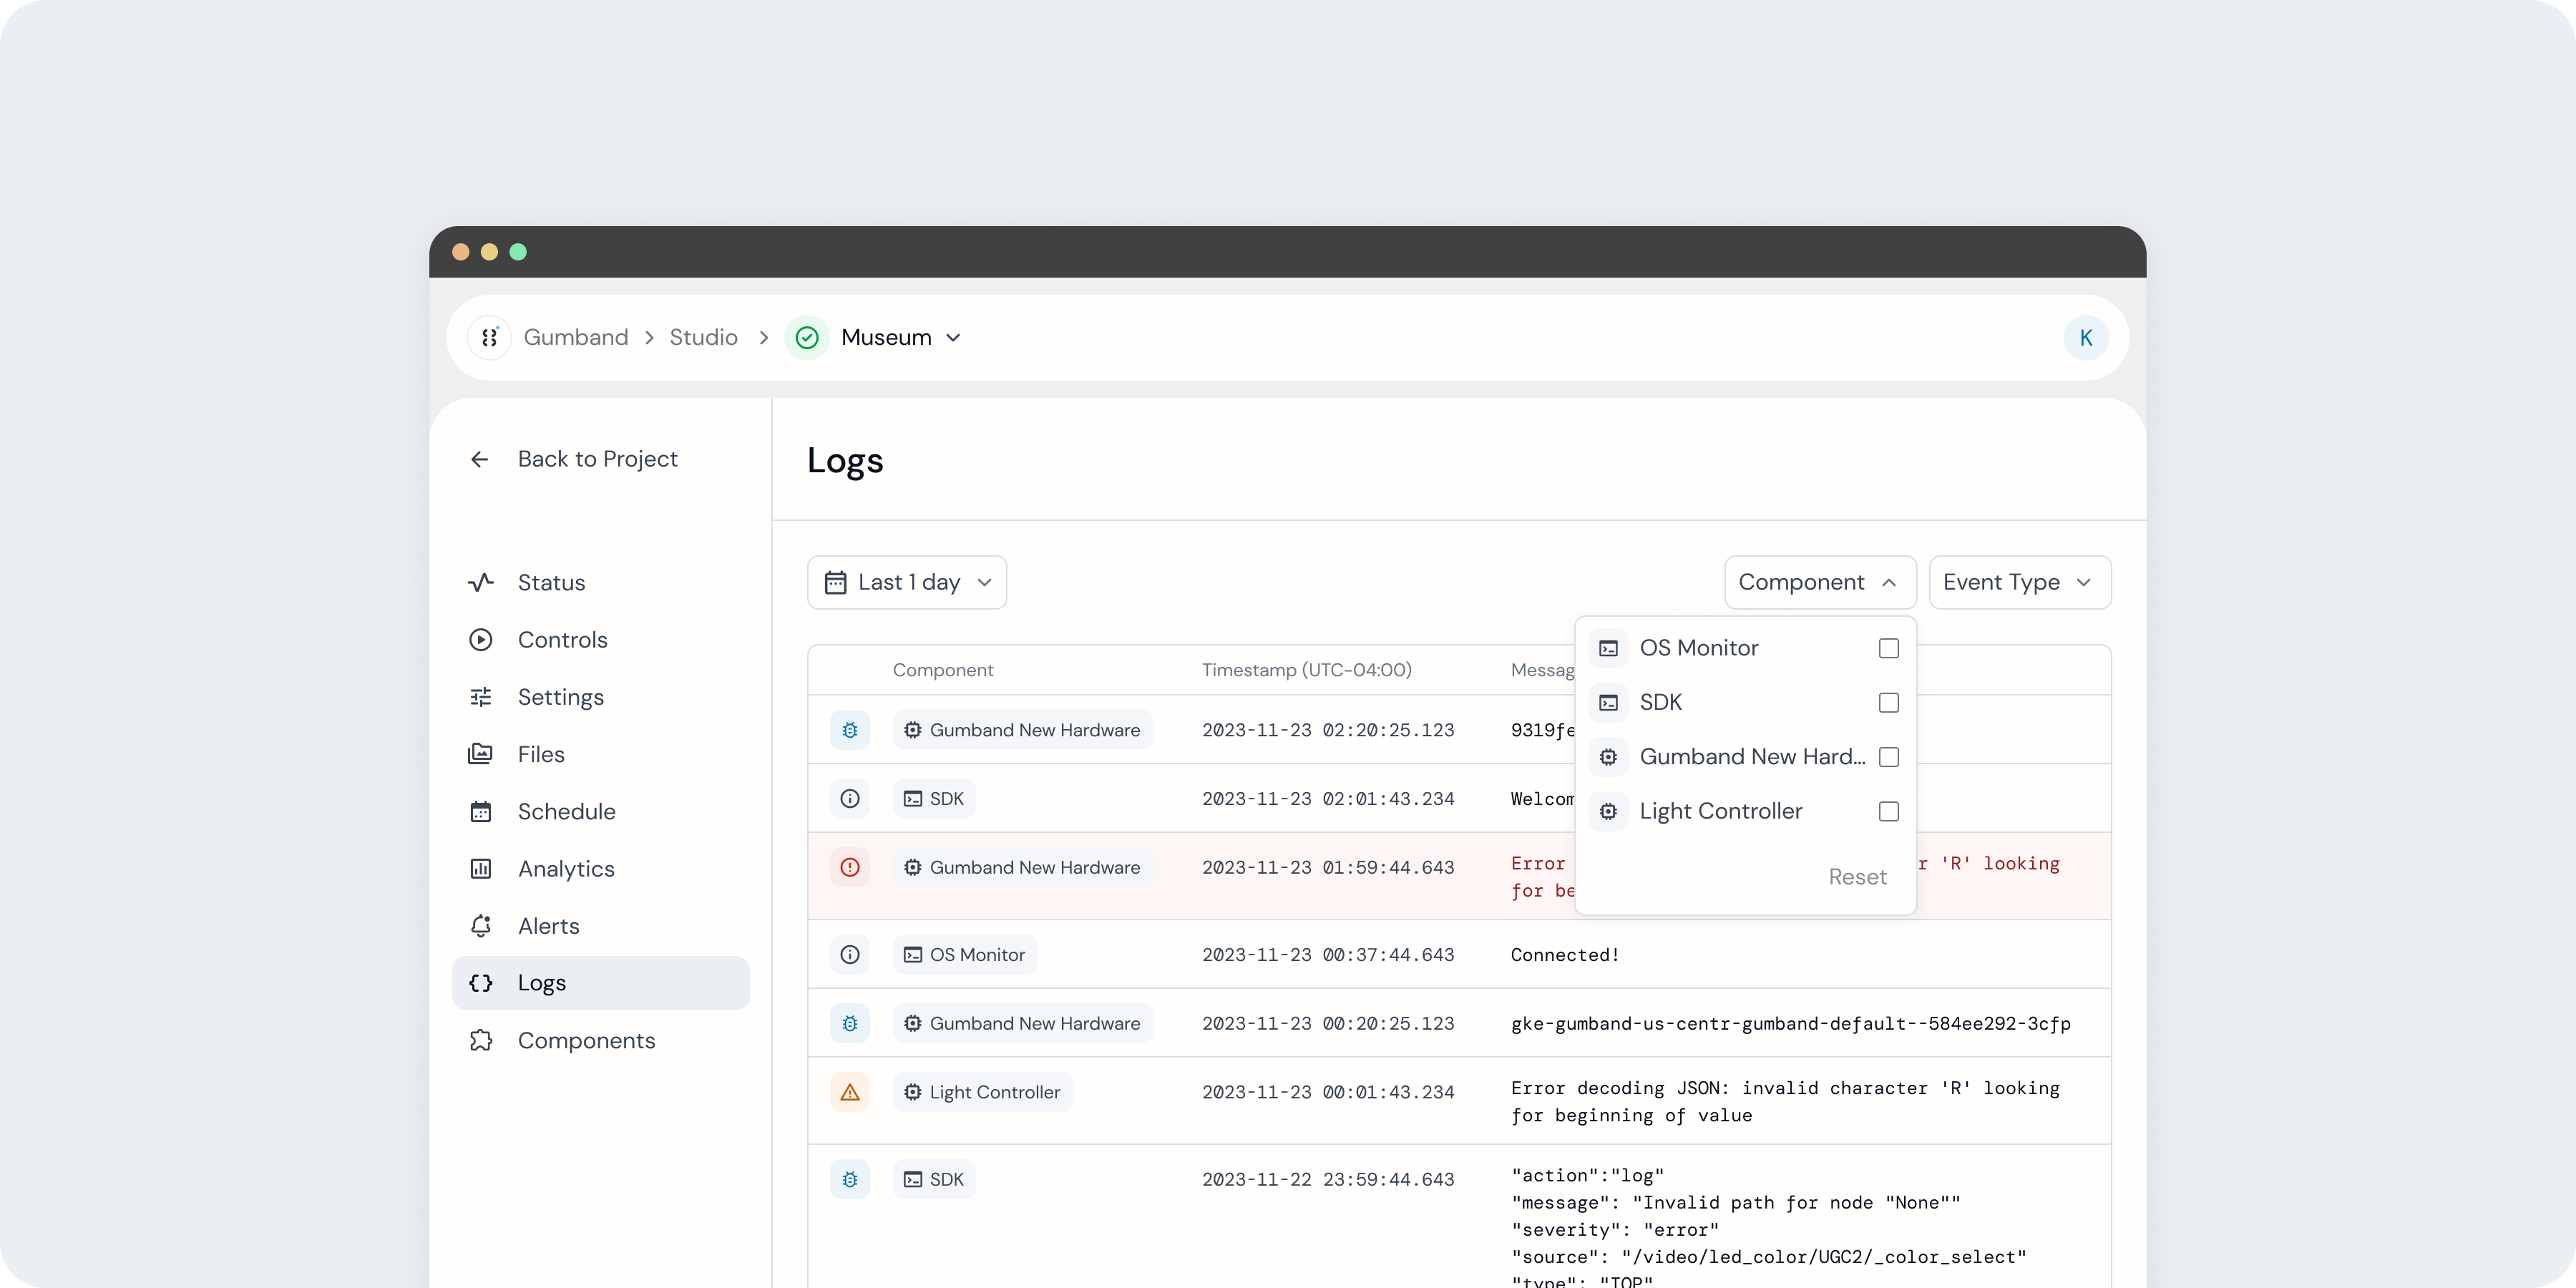 Filtering the Logs table based on component type.
To filter logs by source component, select the Component input above the table’s right-hand side. This input is available as long as your exhibit is composed of more than one component.
Filter by Event Type
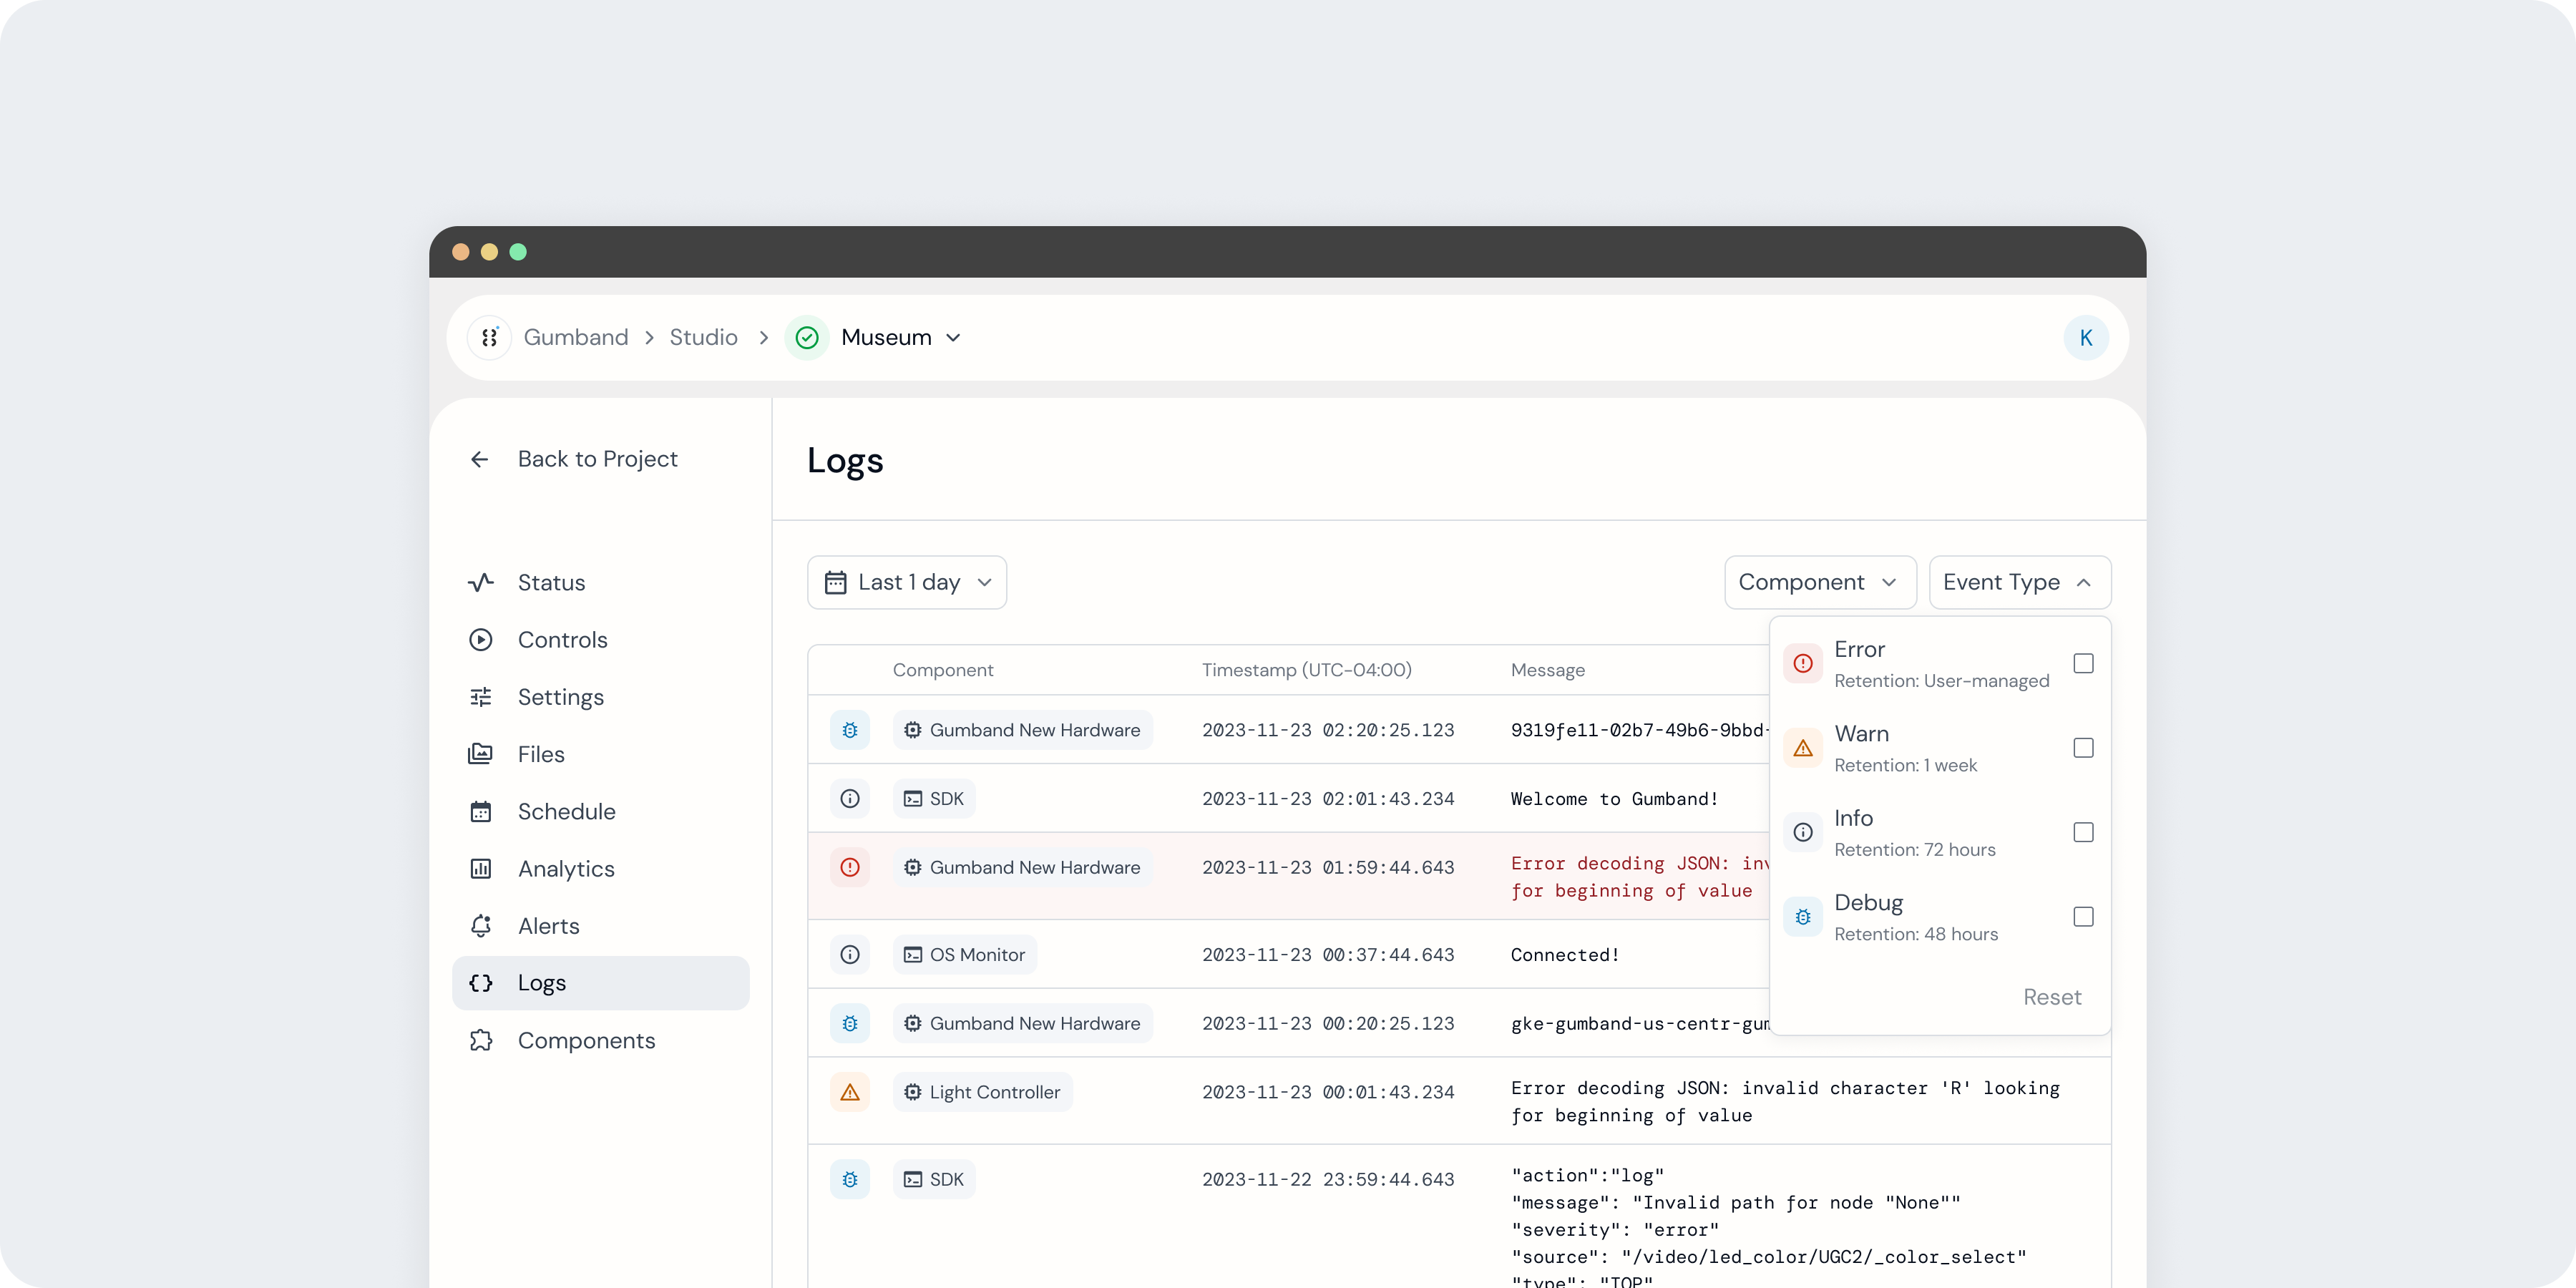 Filtering the Logs table based on component type.
To filter logs by event type (log level), select the Event Type input above the table’s right-hand side. This is especially useful to filter out Info and Debug logs.