Analytics Charts
All Gumband analytics charts are built from two sources:
- Presence data sent from our Presence Sensor.
- User interaction events sent through one of our SDKs.
Collecting data from a Presence Sensor is simple and seamless, as it’s an out-of-the-box solution. Once the sensor is online and registered, Gumband automatically begins gathering dwell data, which is displayed on the Analytics page in the ProjectX UI.
However, when it comes to capturing user interaction data from an exhibit using one of our SDKs, the process is more customizable. Since the types of interactions and data structures vary between exhibits, creating charts based on this data requires a tailored approach.
The purpose of this doc is to introduce you to custom charts, and to provide a catalog of available chart templates.
Key Terms
There are really only two terms to understand when defining user interactions for your exhibit: Events and Interactions
- Events are singular moments in time when something happens on the exhibit due to a user action like a button press.
- An Interaction is a collection of Events that occurred within a specific window of time, typically representing a single, complete user experience of the exhibit.
Interactions are automatically started by Gumband when user Events are sent from the exhibit as long as a previous user interaction has not already been started.
Interactions end in one of two ways:
- When a configured timeout is reached.
- When an exhibit forces an interaction to end. This would only occur when the user takes some action that definitively ends the interaction, such as reaching the end of a questionaire or survey.
Creating Your First Interaction
Since an Interaction is created when a user event is sent, creating an Interaction is as easy as sending a single user event. To create a user event, you must provide two components:
- The name of the event gives context as to what kind of user interaction this event represents; e.g. "ButtonPress", "ContentSelection", etc.
- The data object supplies metadata to the event. This holds the specifics of this particular event, and could be anything from the color of the button pressed to the title of the content that was selected.
- Node.js
- Python
import { Gumband } from "@deeplocal/gumband-node-sdk";

this.gumbandSDK = new Gumband(
    process.env.EXHIBIT_TOKEN,
    process.env.EXHIBIT_ID
);

/**
 * This function is called whenever a user selects some content. The name of the event is "ContentSelection",
 * and the metadata object describes the content that was selected.
 **/
onUserContentSelection(metadata: any) {
    //This function takes a "name" and a "data" argument
    this.gumbandSDK.metrics.create("ContentSelection", metadata);
}
from gumband_python_sdk import Gumband

self.gumband = Gumband(
    exhibit_id=exhibit_id,
    token=token
)
await self.gumband.connect()

def on_user_content_selection(self, metadata: dict):
    """
    This function is called whenever a user selects some content. The name of the event is "ContentSelection",
    and the metadata object describes the content that was selected.
    """
    #This function takes a "name" and a "data" argument
    self.gumband.create_event("ContentSelection", metadata)
- For more info on how to create an exhibit and get an ID and token, see creating a new exhibit.
- At this time, Gumband analytics only supports flat metadata structures; i.e. User Interaction charts may only be able to access the first level of the metadata object.
After connecting the SDK to Gumband, sending a user event, and waiting sixty seconds for the interaction to timeout (the default), you will see a new chart called "Interactions" on the Analytics page of the Gumband UI:
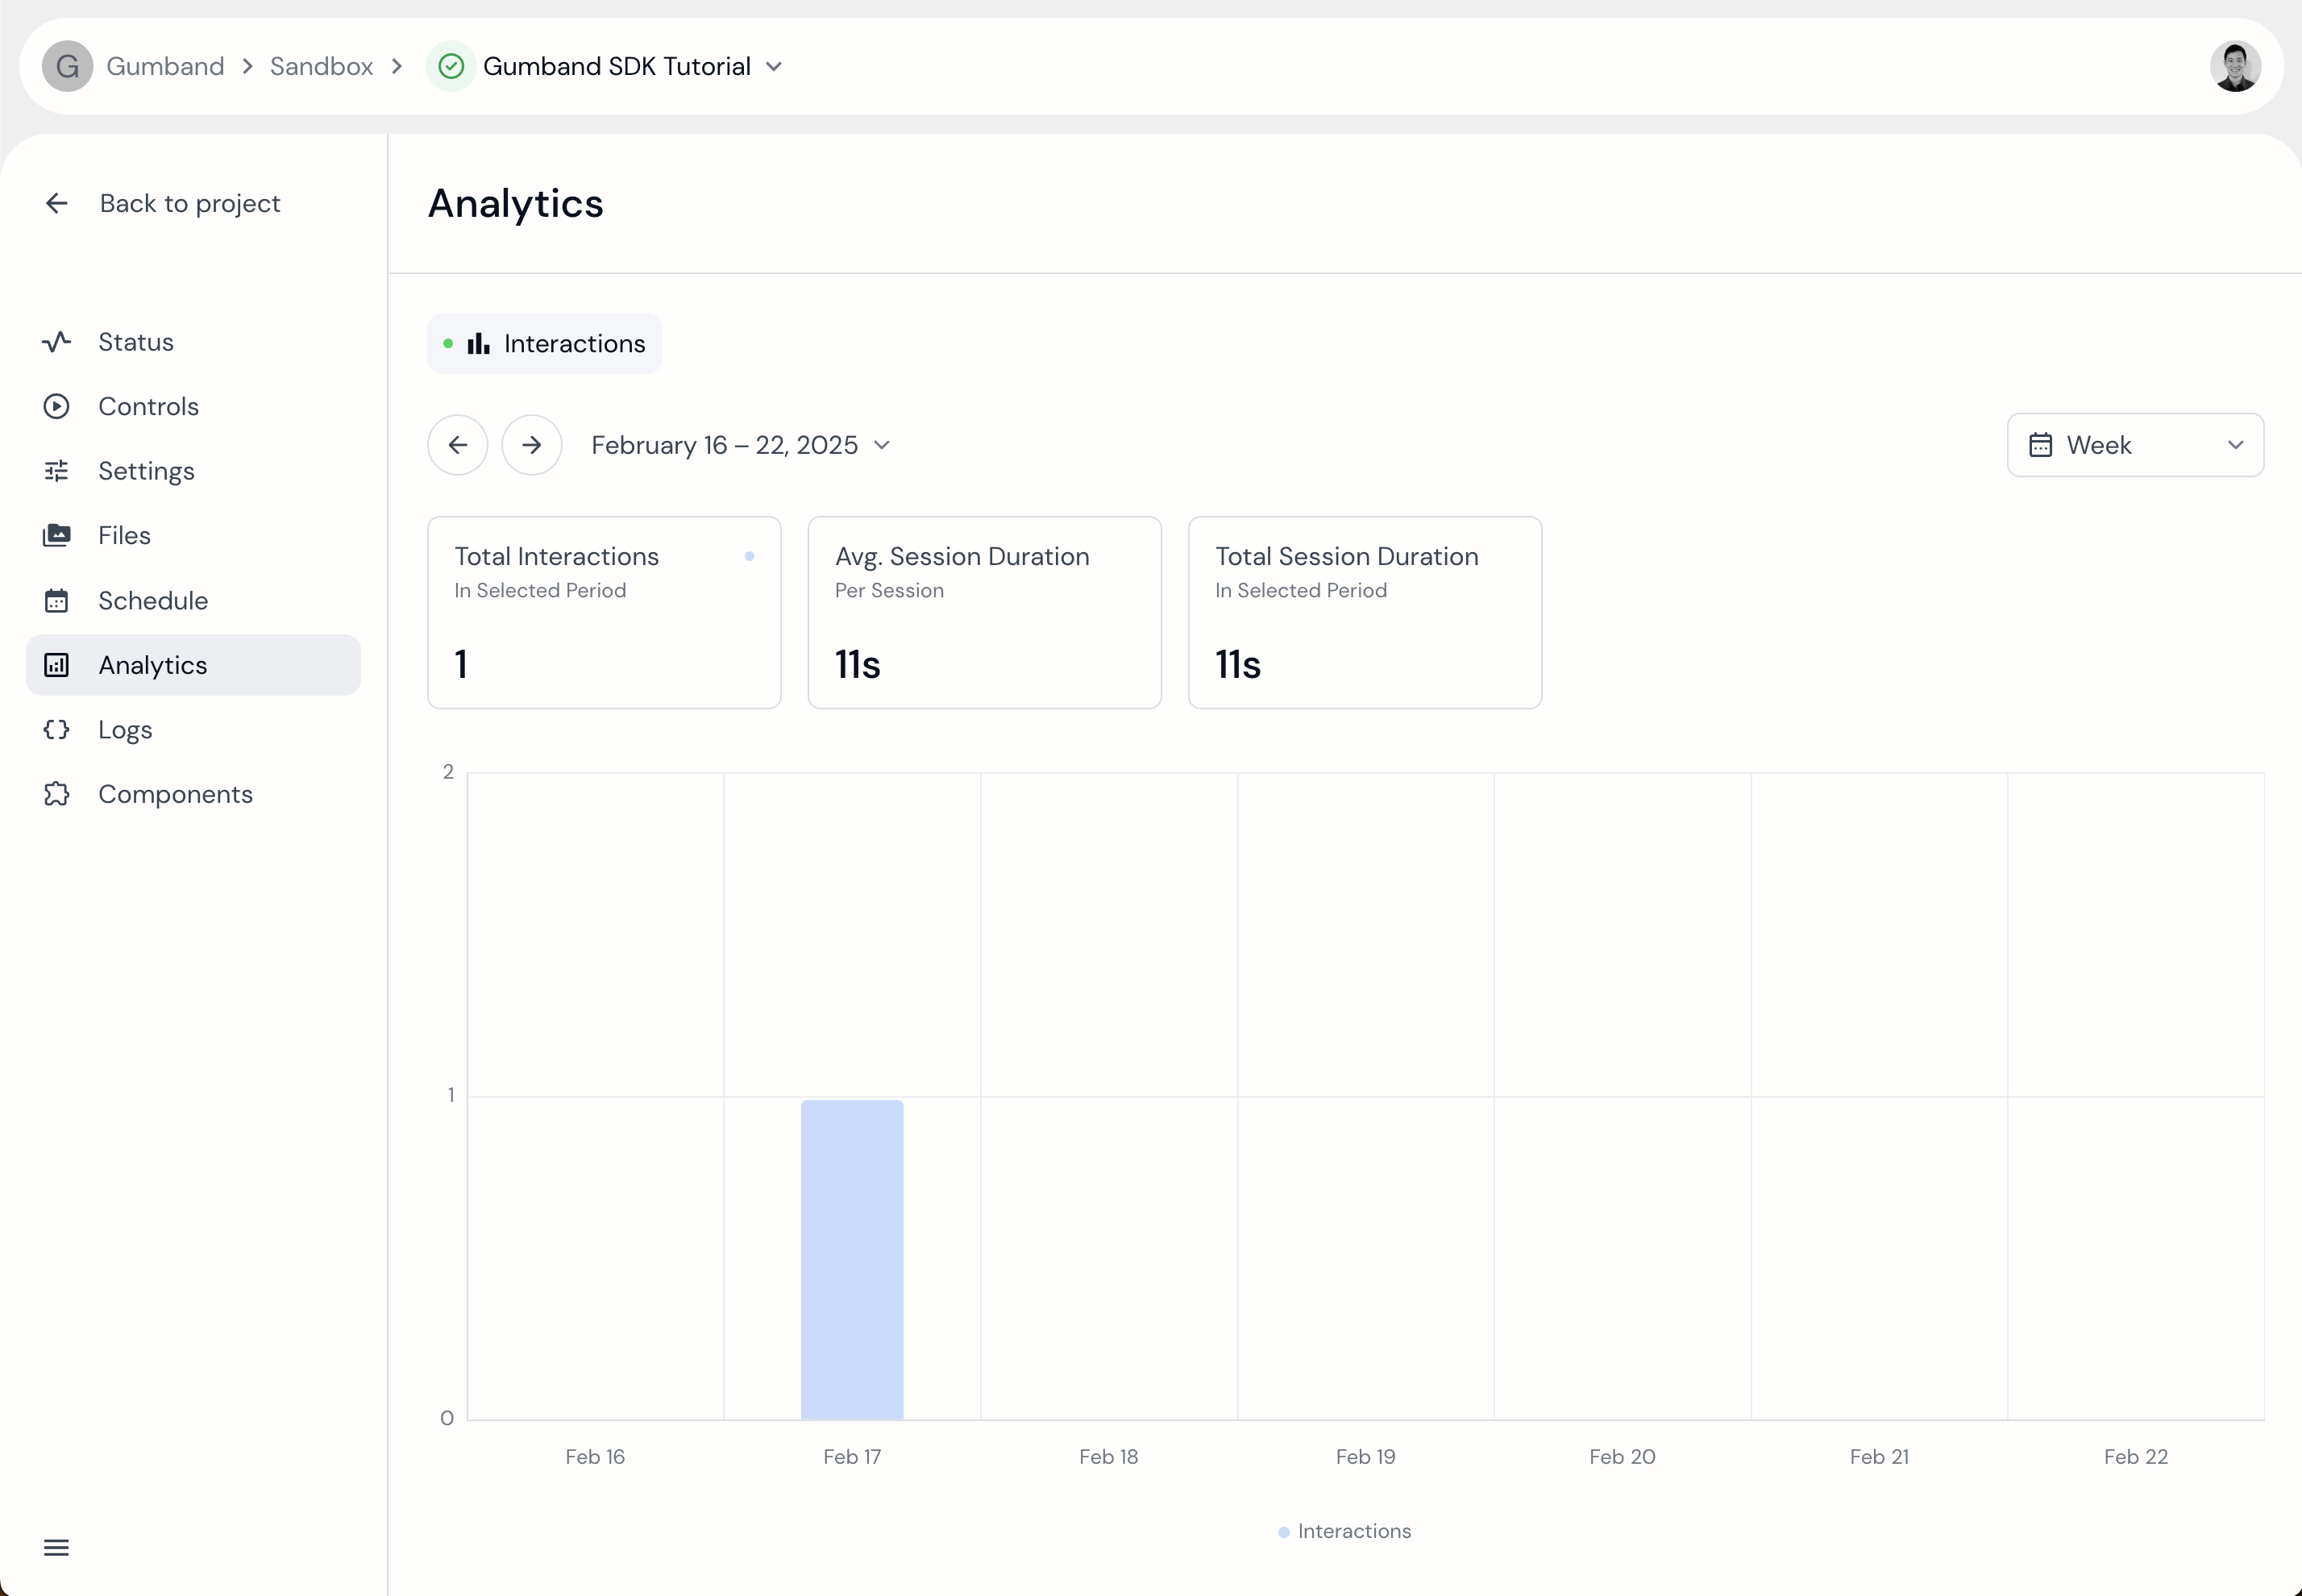 An interaction chart in the Gumband UI will show once an interaction is recorded.
Manually End an Interaction
There may be instances where you need to end the interaction before the default timeout elapses; e.g. when a user is taking a survey and they complete the survey. For this use case we provide a method to manually end the interaction:
- Node.js
- Python
...

function docentManuallyResetsExhibit() {
    this.gumbandSDK.metrics.endInteraction({
      "reason": "Docent ended the interaction"
    });
}
...

async def docent_manually_resets_exhibit(self):
  await self.gumband.end_interaction({
    "reason": "Docent ended the interaction"
  })
Call this method will take any interaction that is “open” and will close it, no longer accepting new events. Any subsequent new events will open a brand new interaction.
Configure the Interaction Timeout
Previously, we had discussed how Gumband waits 60 seconds without seeing any new events before it closes the interaction. Any new events will reset the 60 second countdown. Consequently, as long as your events continue to arrive in a timely manner, you can certainly have an interaction that lasts much longer than 60 seconds. In theory you can create an infinite interaction if you keep sending in Gumband.create_event calls!
We do provide the ability to change the default interaction timeout for your exhibit within certain bounds.
The minimum value is 5000 (5 seconds).
The maximum value is 900000 (15 minutes).
If you wish to override the default of 60 seconds, you can:
- Node.js
- Python
export const MANIFEST = {
    manifest: {
        statuses: [...],
        controls: [...],
        settings: [...],
        metrics: [
            {
                interactionTimeoutMs: 15000 // a 15 second timeout
            }
        ]
    }
}
from gumband_python_sdk import Gumband, GumbandOptions
from gumband_python_sdk.constants import SocketEventType

class GumbandWrapper:
  def __init__(self, exhibit_id, token, manifest):
    """
    Initialize the GumbandWrapper with necessary parameters.
    """
    self.gumband = Gumband(
      exhibit_id=exhibit_id,
      token=token,
      manifest=manifest,
      # This will set the interaction timeout to 15 seconds.
      options=GumbandOptions(interaction_timeout=15000)
    )
Concurrent Interactions
This feature is currently only available through the Node SDK.
Some exhibits may have multiple users interacting with it at one time. To handle this scenario, Gumband provides additional methods that specify which specific interaction an event belongs to. These functions mirror the regular create and endInteraction, and are called createConcurrent and endConcurrentInteraction. The only difference is that these methods take an interactionId and always return the interactionId with which their event will be associated. To start an interaction, simply call the createConcurrent method without an interactionId and Gumband will generate one for you:
// File: your-code.js
const { Gumband } = require('@deeplocal/gumband-nodejs-sdk');
// or import { Gumband } from '@deeplocal/gumband-nodejs-sdk'

const gb = new Gumband(EXHIBIT_TOKEN, EXHIBIT_ID, PATH_TO_MANIFEST);

function exhibitWokenFromIdleState() {
    let interactionId = gb.metrics.createConcurrent('Exhibit Woken', {});

    console.log(interactionId);
    // 0357892a-68e0-49cc-bf2d-18a8ca563f68
}
You will need to keep track of this interactionId while the interaction is ongoing. To add more more events to the same interaction, add the returned interactionId on subsequent event calls:
function contentSelected(interactionId) {
    gb.metrics.createConcurrent(
        'Content Selection',
        { name: 'content' },
        interactionId
    );
}
Charts Catalog
Now that you have the basics down, you can start thinking about what kinds of analytics can be captured from your exhibit. Gumband offers a variety of configurable charts, each of which can be tailored to your exhibit's unique data payloads.
At this time, all charts other than the Interactions chart must be set up by the Gumband team. Please email the Gumband team at support@gumband.com if you need assistance.
Interactions
The Interactions chart, as previously mentioned, is our default user interaction chart. It simply counts the total number of interactions for each time period in addition to some metrics around session duration.
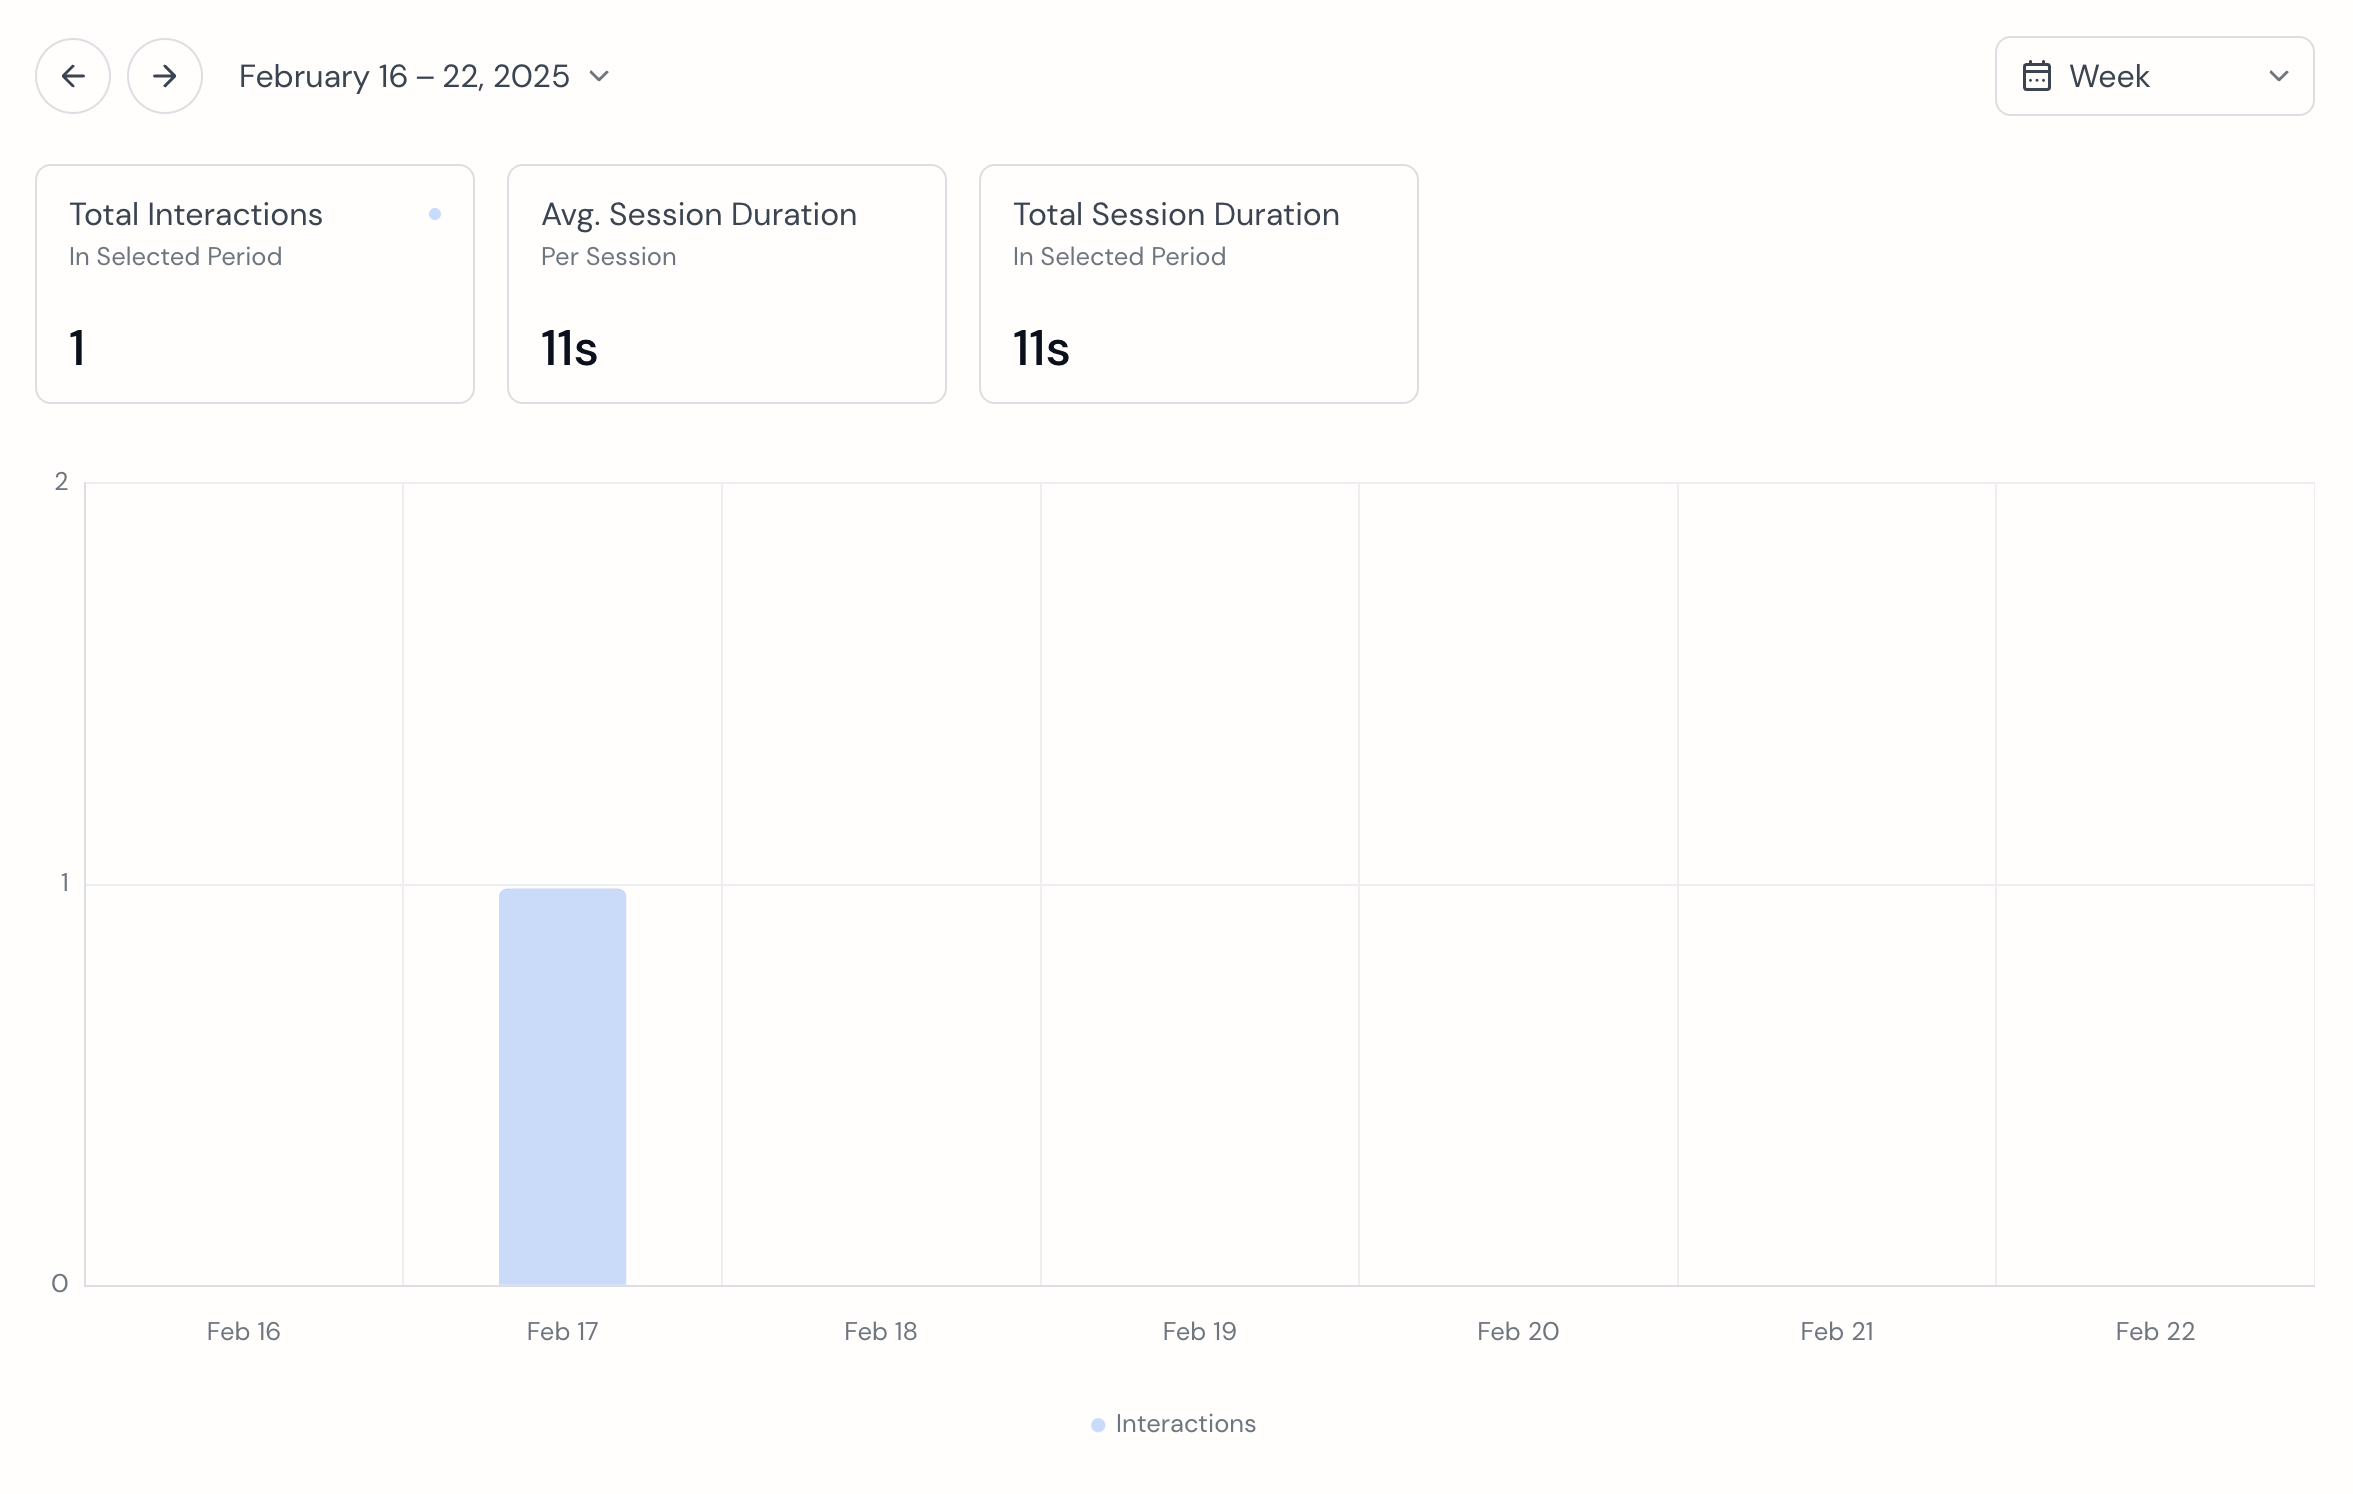 The Interactions chart shows the total number of interactions in the selected time period.
Session Duration
The Session Duration chart is similar to the Interactions chart, but it shows some different metrics cards and tooltips. The Session Duration chart will function with any exhibit, regardless of the data payloads of any user events.
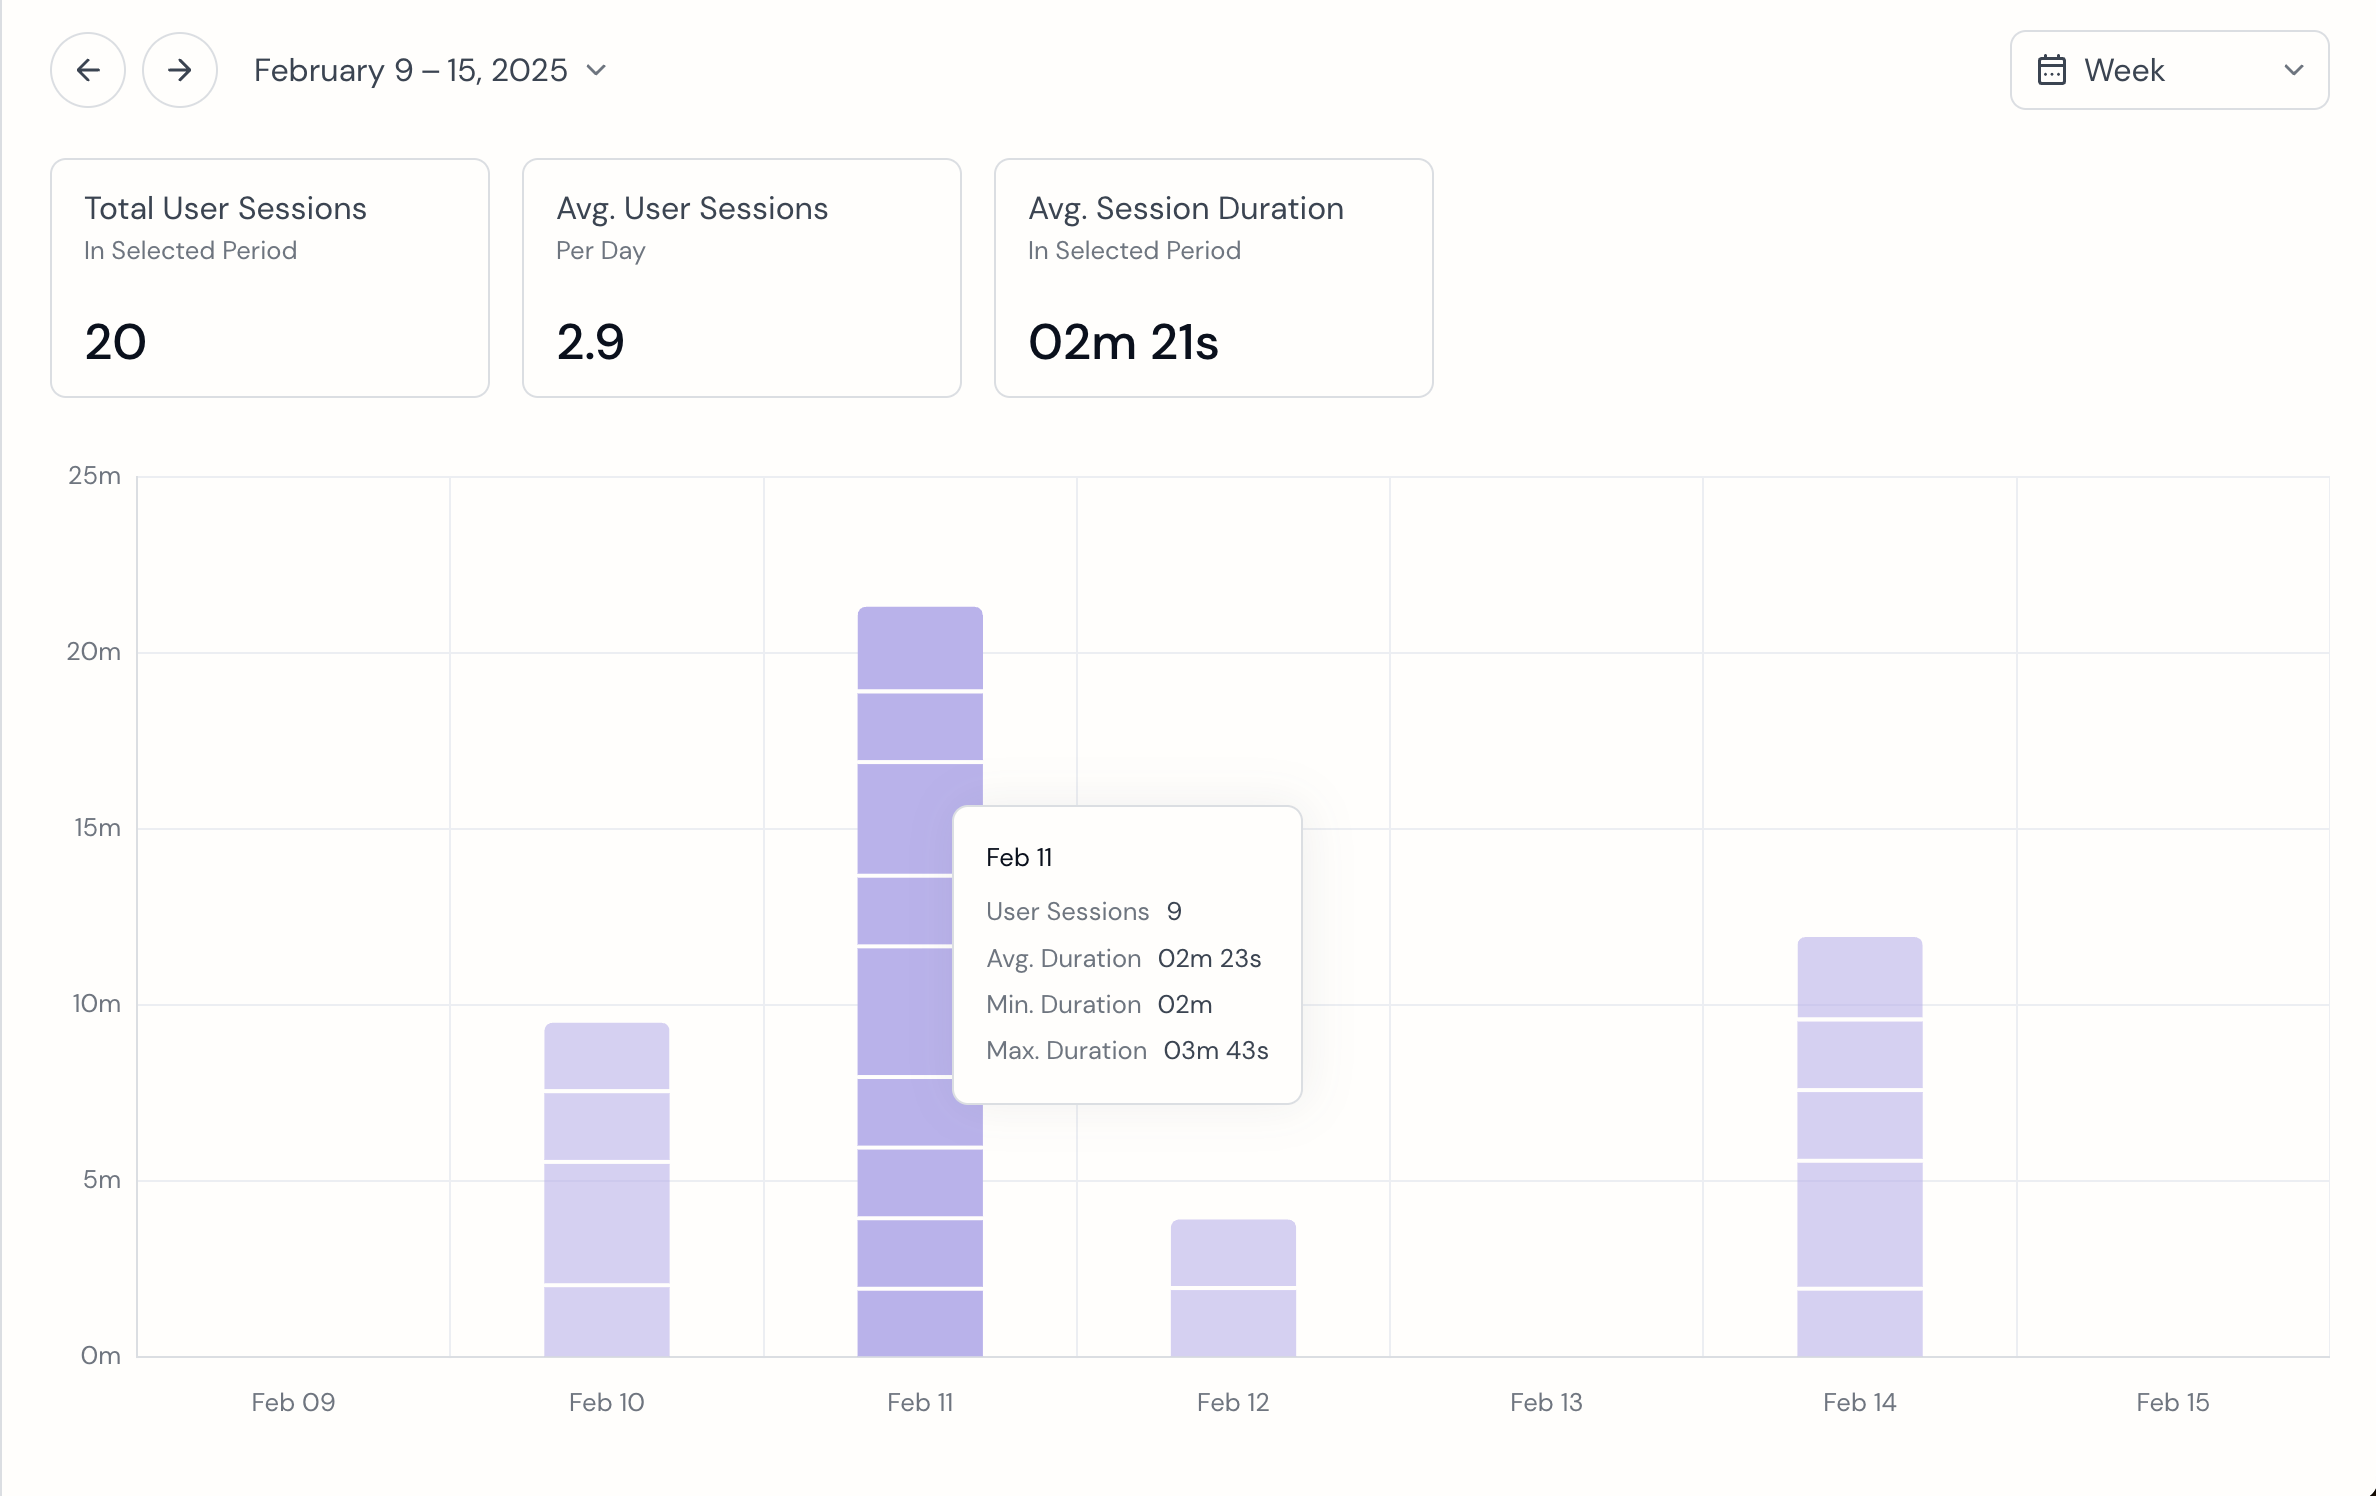 The Session Duration chart shows the average, maximum, and minimum session durations on hover.
Selections Per User
The Selections Per User chart shows how many user actions take place in each interaction. Like the Interactions and Session Duration charts, the Selections Per User chart is agnostic to the shape of user events, since it is simply counting the number of events in each interaction.
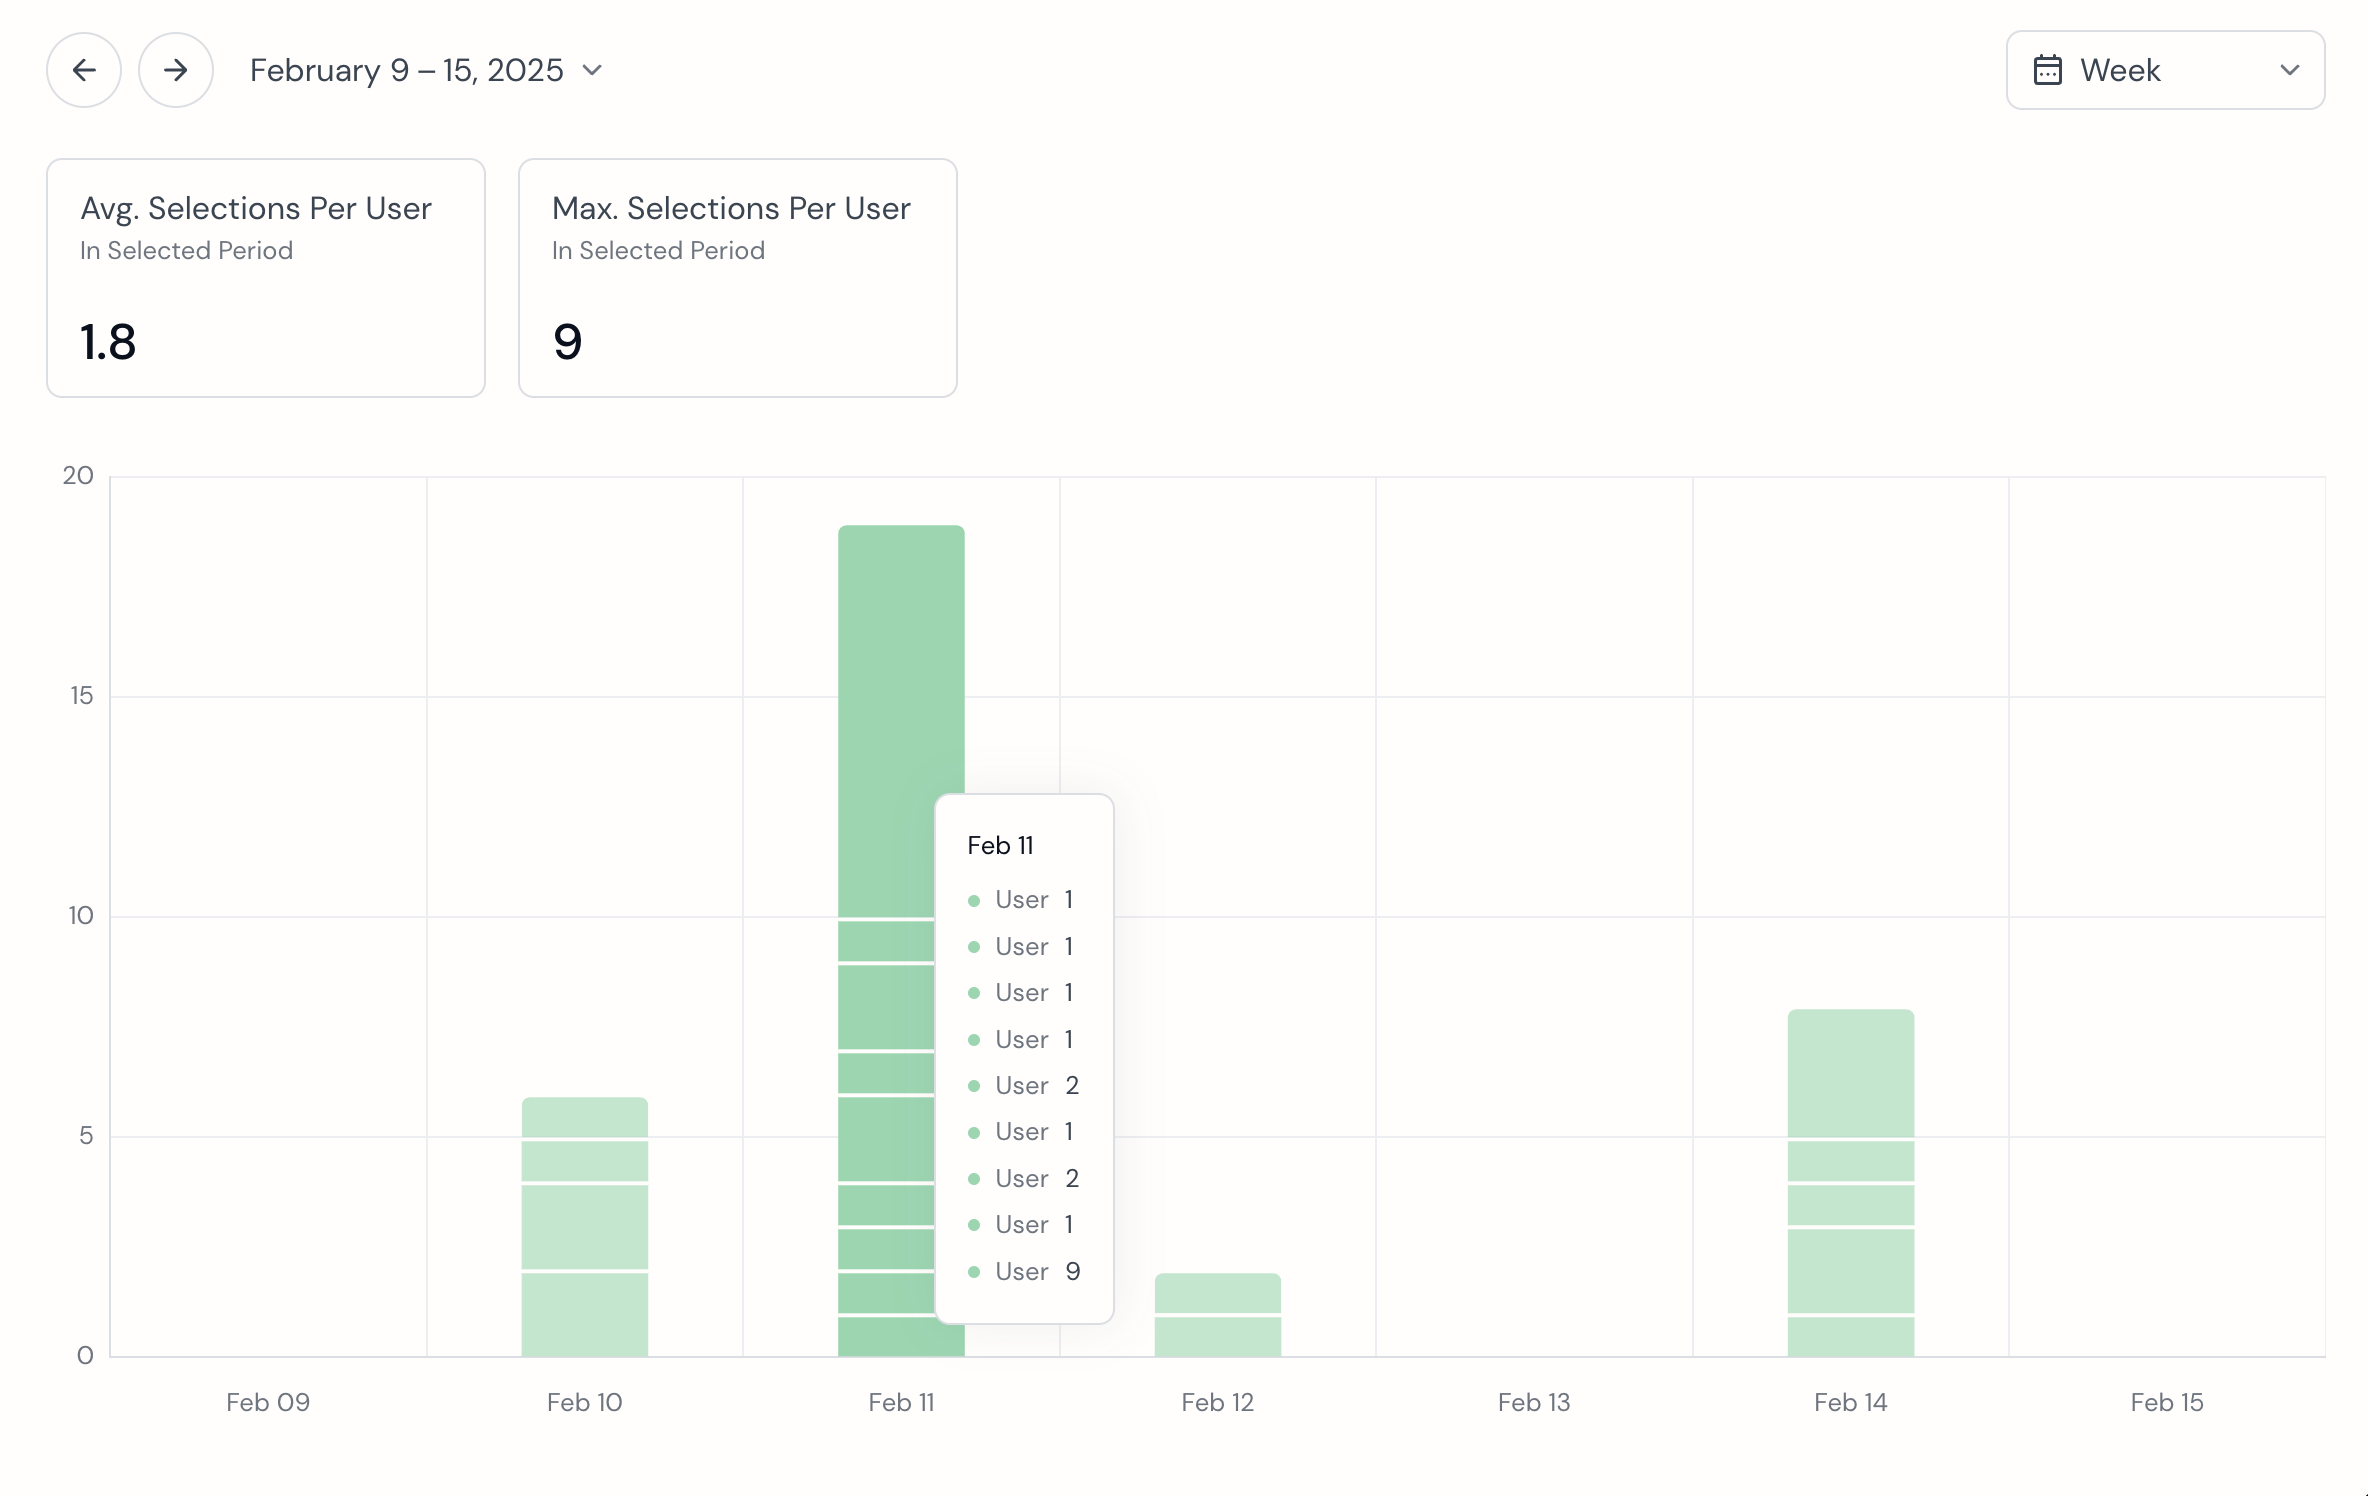 The Selections Per User chart shows the number of user events which occurred during each interaction.
Drop Off
The Drop Off chart highlights the last meaningful user event before an interaction ends, helping to identify content or experiences that may lead to disengagement. The Drop Off chart can be configured only to include certain event types that you define.
The following code snippet shows an example of how to send user events from the SDK. These collective events could represent an interaction for a single entry into the chart below:
- Node.js
- Python
simulateUserInteraction() {
    //User enters the exhibit. The interaction begins with this first user event.
    this.gumbandSDK.metrics.create("UserEnters", {});

    //User selects "Conan Drone" after 5 seconds
    setTimeout(() => {
        this.gumbandSDK.metrics.create("ContentSelection", { title: "Conan Drone" });
    }, 5000)

    //User exits exhibit 30 seconds after the content selection.
    setTimeout(() => {
        this.gumbandSDK.metrics.create("UserExits", {});
    }, 35000)
}
async def simulate_user_interaction():
    #User enters the exhibit. The interaction begins with this first user event.
    await self.gumband_sdk.create_event("UserEnters", {})

    #User selects "Conan Drone" after 5 seconds
    sleep(5)
    await self.gumband_sdk.create_event("ContentSelection", { title: "Conan Drone" })

    #User exits exhibit 30 seconds after the content selection.
    sleep(35)
    await self.gumband_sdk.create_event("UserExits", {})
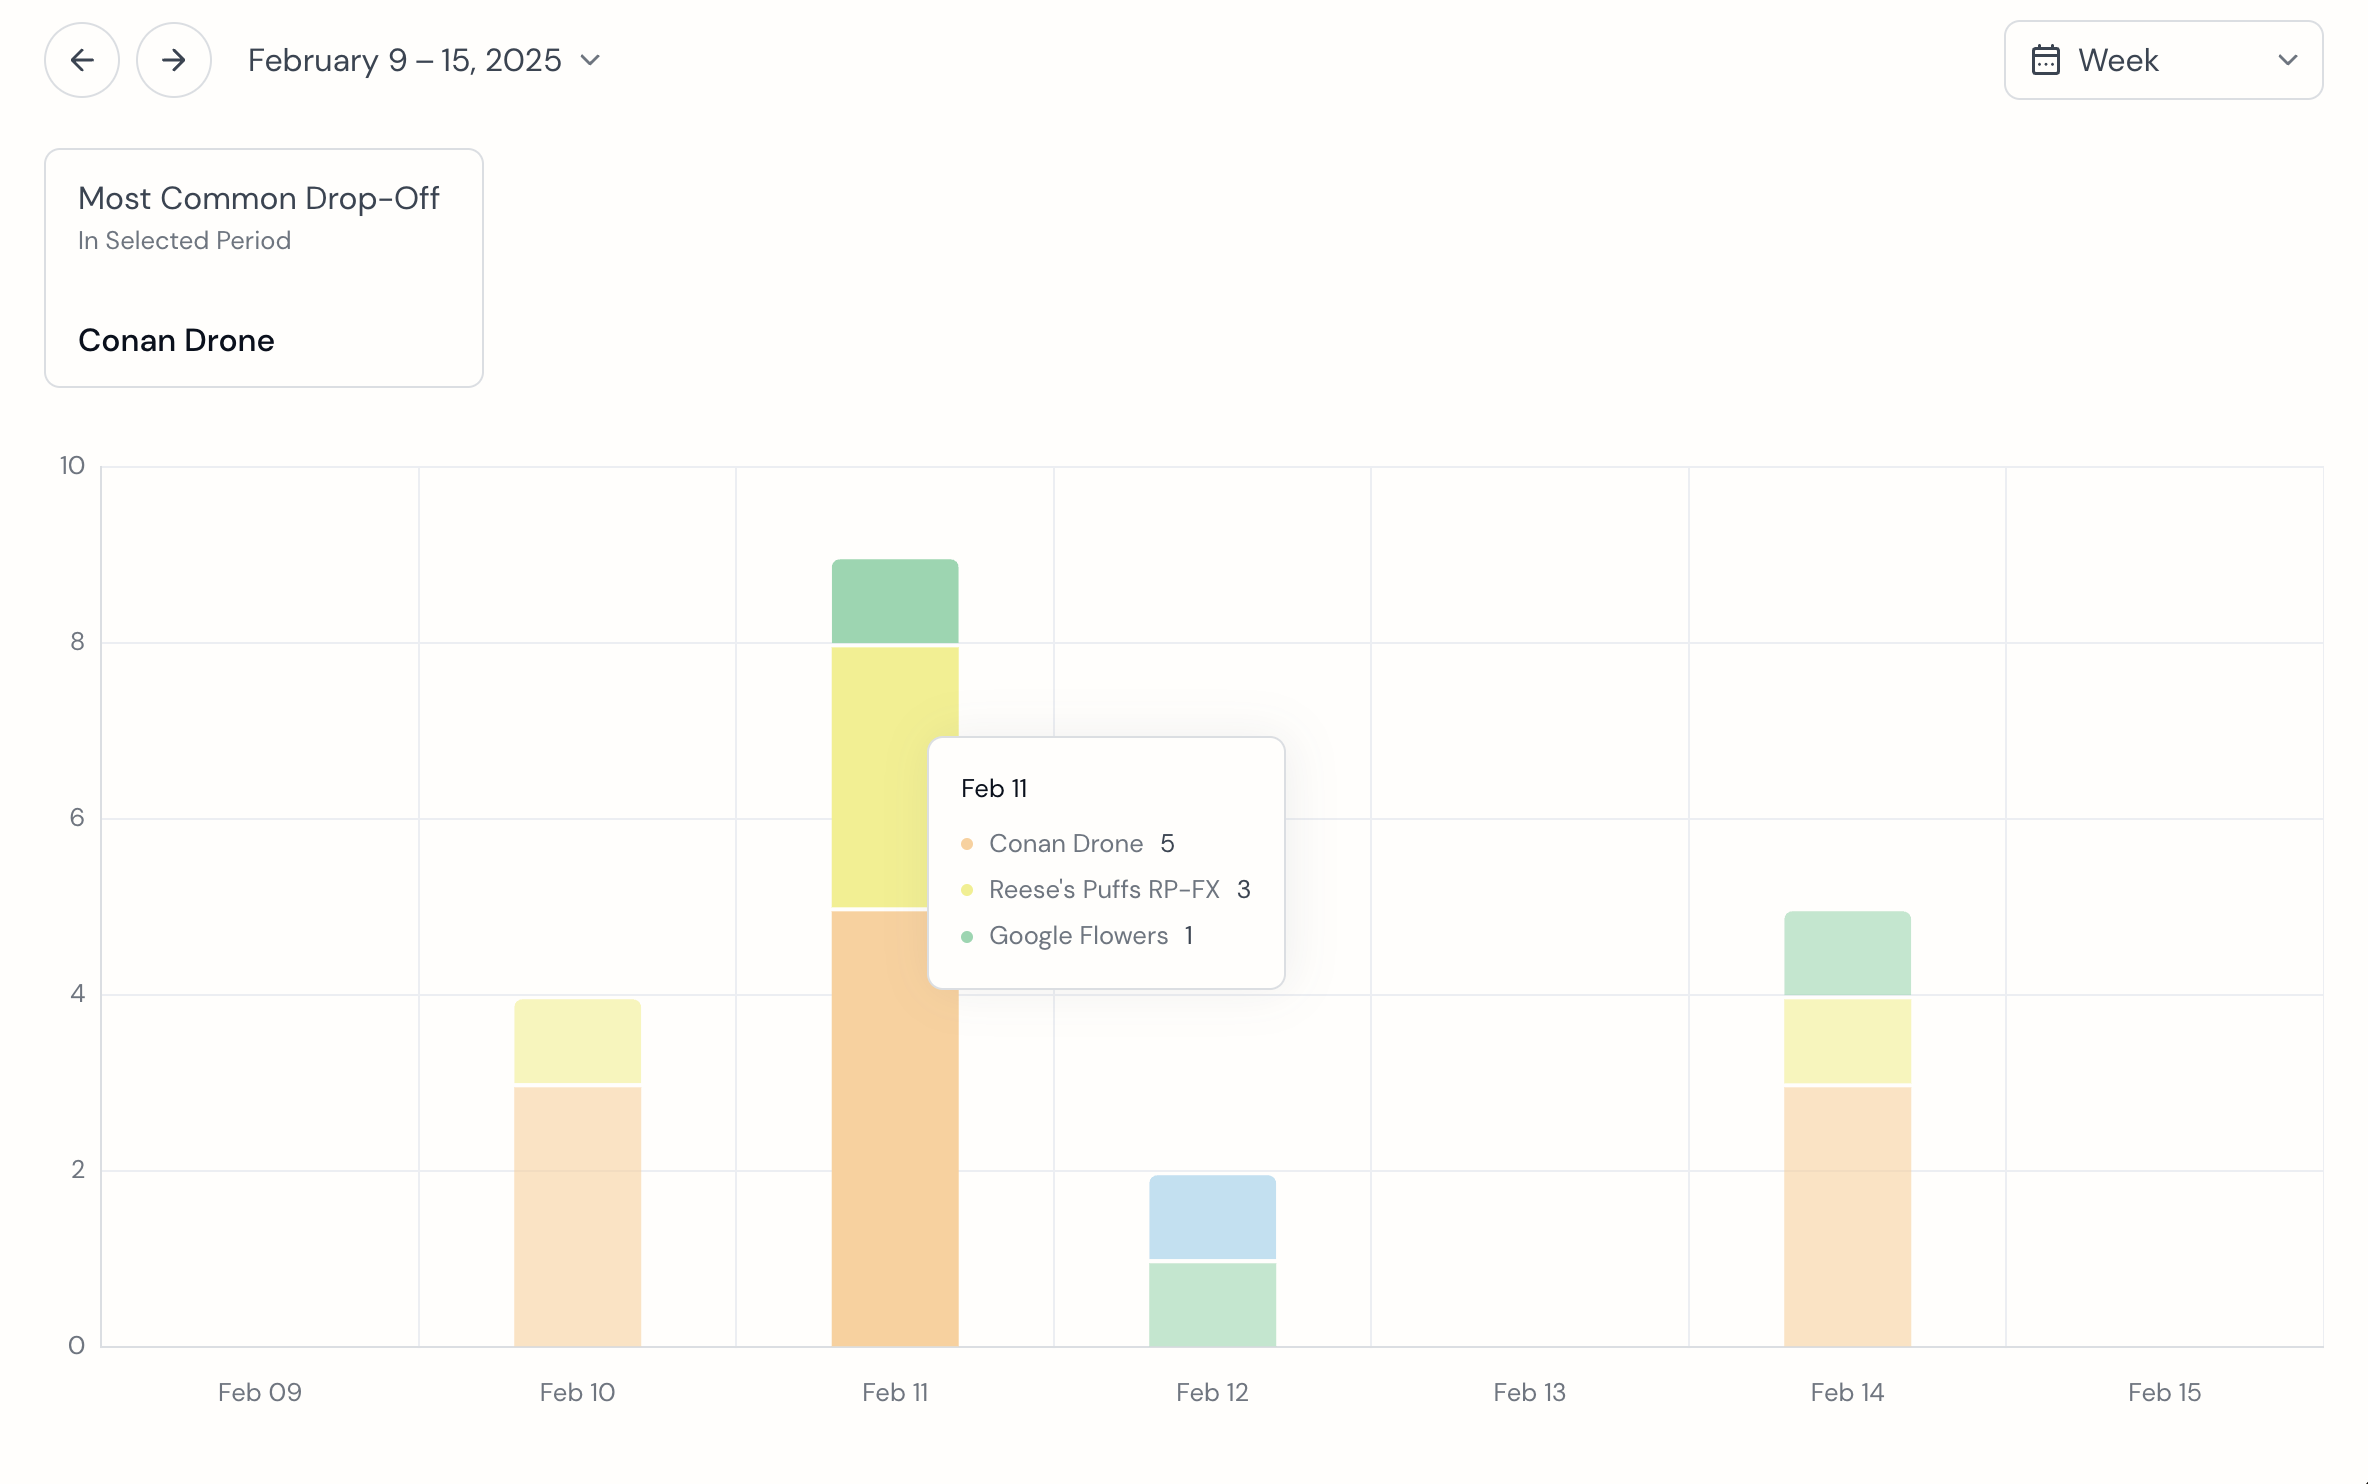 The Drop Off chart shows the last relevant user event at the end of each interaction. This chart is configured to only track "ContentSelection" events, and to render the chart label from the
 data.title field
Category Popularity
The Category Popularity chart visualizes how often users select specific options when presented with a choice. While it’s commonly used to track the popularity of different content categories, it can be applied to any scenario where user preferences are recorded.
Use this chart to:
- Identify the most and least popular content or features.
- Analyze user preferences and engagement patterns.
- Optimize content offerings based on user behavior.
This flexible chart helps you gain deeper insights into user choices, enabling data-driven decisions to improve the exhibit experience.
The following code snippet shows an example of how to send user events from the SDK. These collective events would represent two entries into the chart below:
- Node.js
- Python
simulateUserInteraction() {
    //User begins interaction by making a content selection
    this.gumbandSDK.metrics.create("ContentSelection", { title: "Conan Drone" });

    //User makes another content selection after 30 seconds.
    setTimeout(() => {
        this.gumbandSDK.metrics.create("ContentSelection", { title: "Reese's Puffs RP-FX" });
    }, 30000)
}
async def simulate_user_interaction():
    #User begins interaction by making a content selection
    await self.gumband_sdk.create_event("ContentSelection", { title: "Conan Drone" })

    #User makes another content selection after 30 seconds.
    sleep(30)
    await self.gumband_sdk.create_event("ContentSelection", { title: "Reese's Puffs RP-FX" })
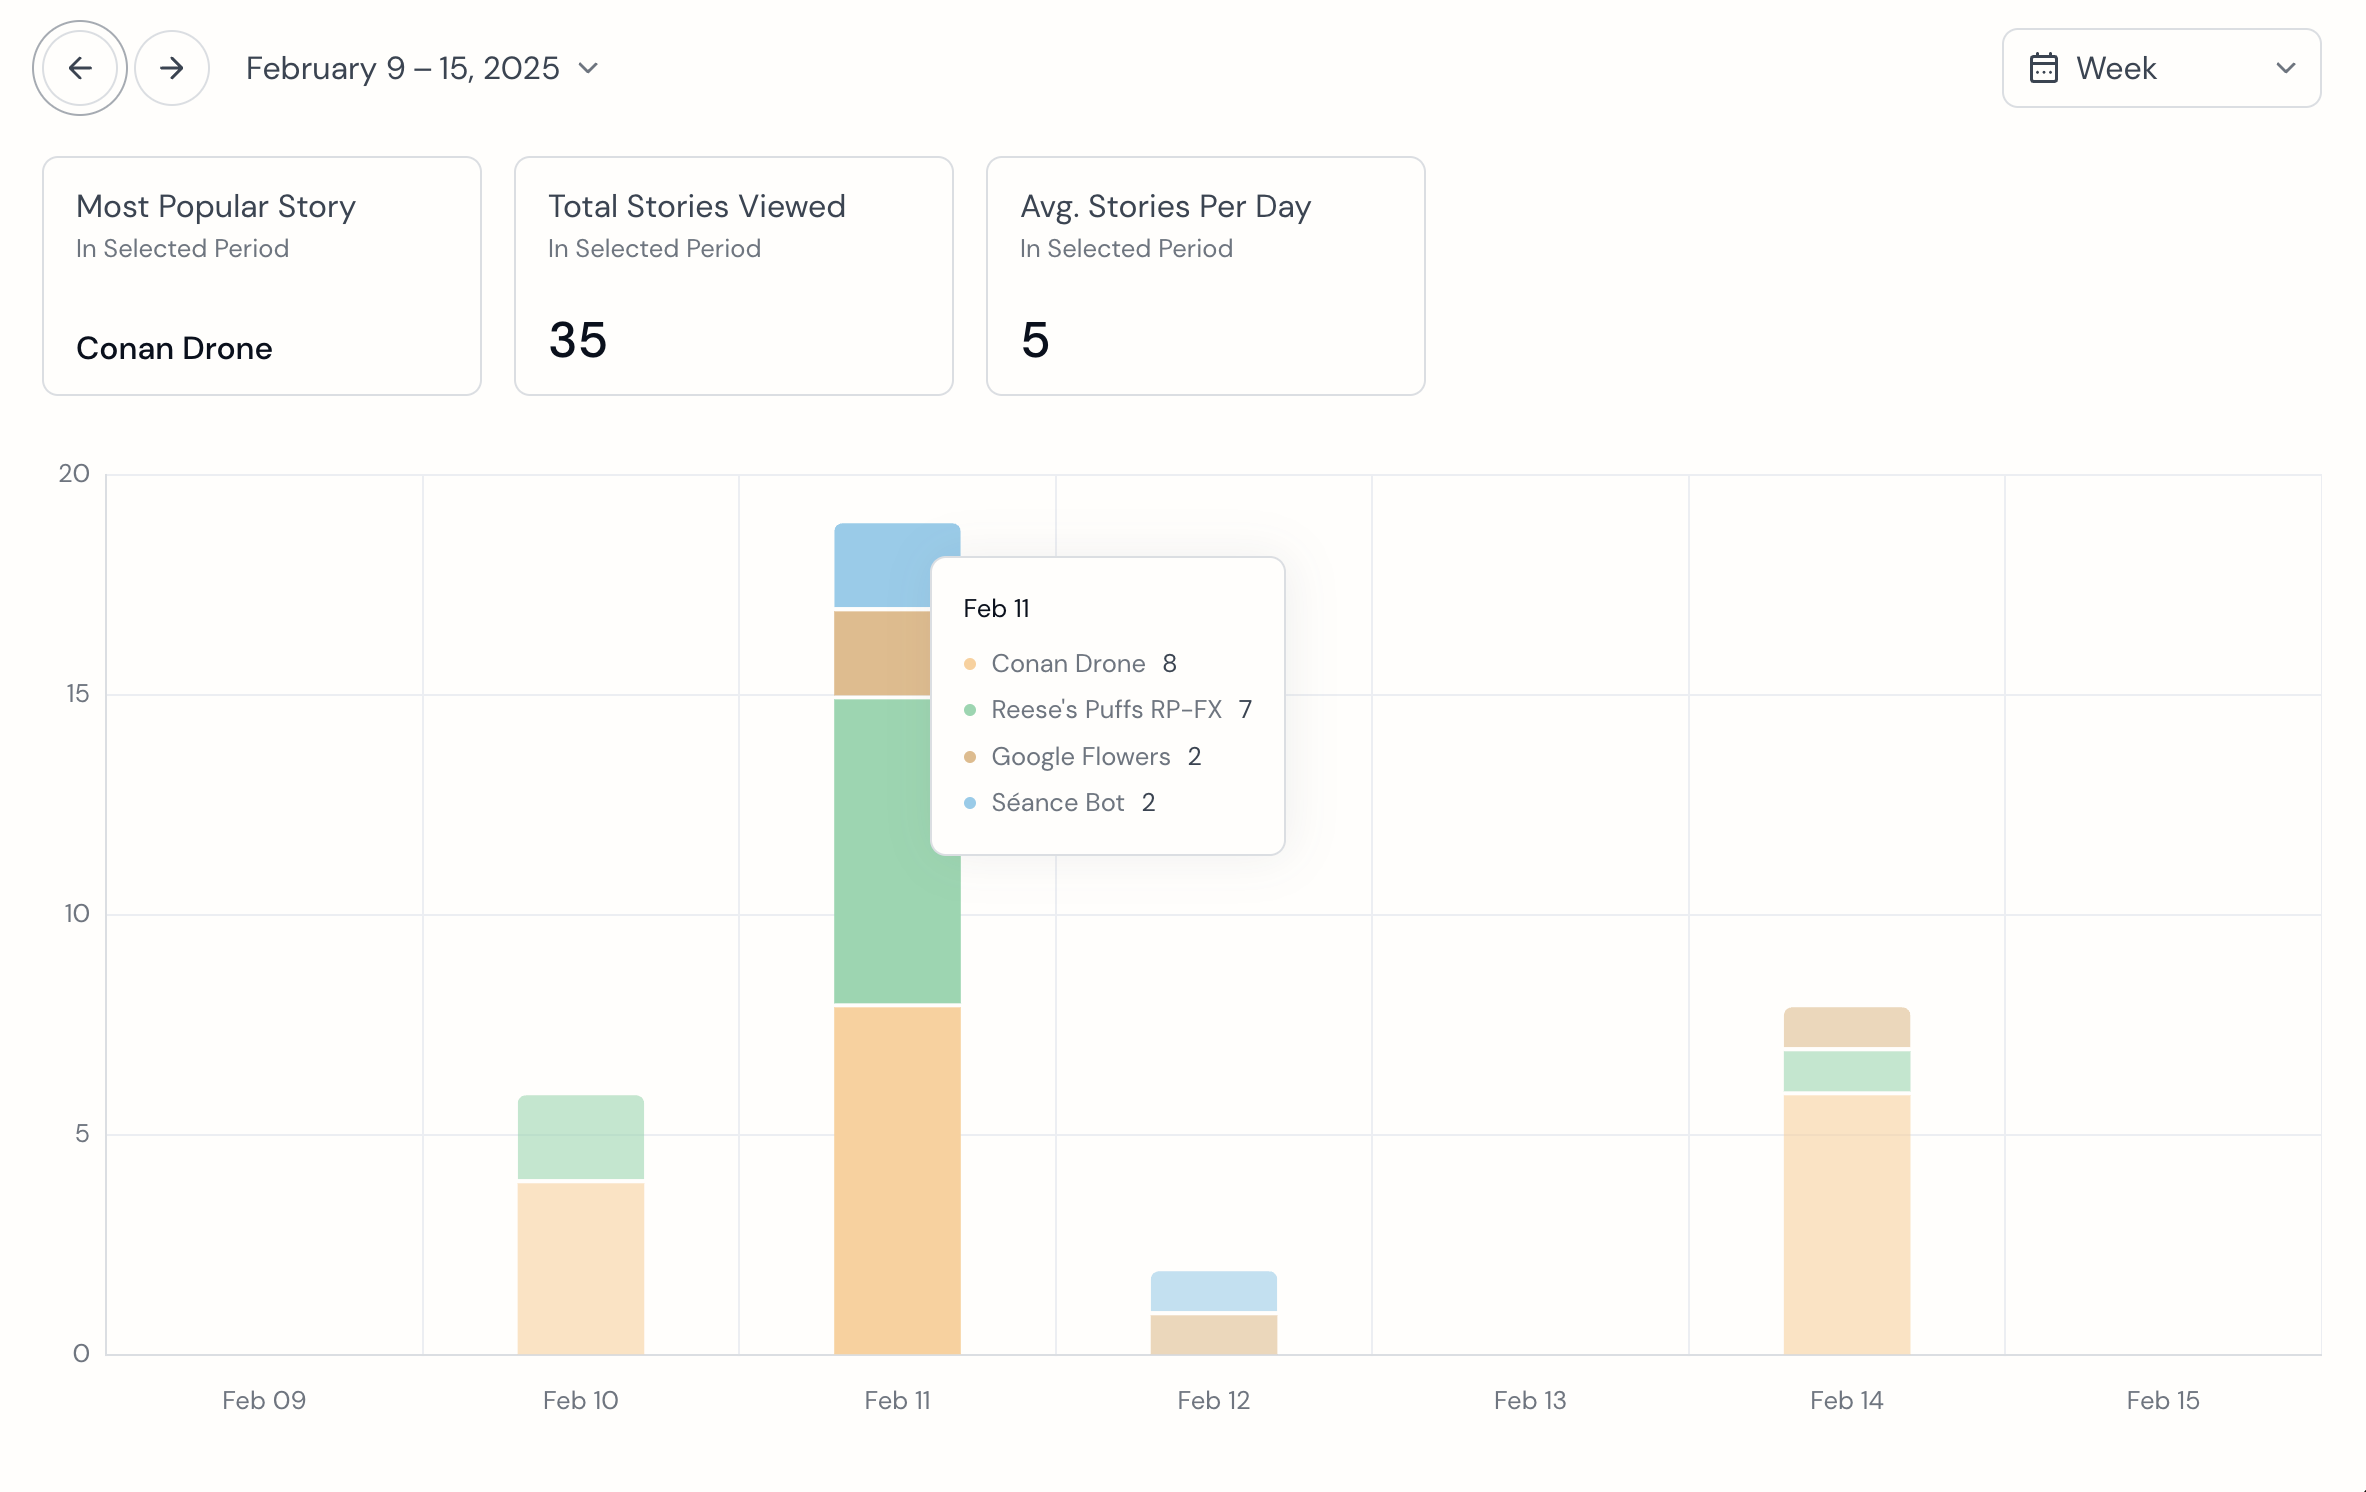 The Category Popularity chart shows the frequency of user choices between different category options. The events from the code snippet would result in two more entries added for this chart: one for "Conan Drone" and one for "Reese's Puffs RP-FX".
Category Duration
The Category Duration chart tracks the amount of time a user spends engaging with specific content. This is particularly useful in scenarios where users aren’t required to make an initial content selection but have control over how long they interact with each piece of content before moving on or exiting.
Use this chart to:
- Measure user engagement with individual content pieces.
- Identify which content holds attention the longest.
- Gain insights into user preferences based on dwell time.
By analyzing time-based engagement, the Category Duration chart helps you understand what content resonates most with your audience.
The following code snippet shows an example of how to send user events from the SDK. These collective events would add duration to each of the user selections in the chart below:
- Node.js
- Python
simulateUserInteraction() {
    //User begins interaction by making a content selection
    this.gumbandSDK.metrics.create("ContentSelection", { title: "User Option 1" });

    //delay the next user selection 30 seconds
    setTimeout(() => {
        this.gumbandSDK.metrics.create("ContentSelection", { title: "User Option 2" });
    }, 30000)
}
async def simulate_user_interaction():
    #User begins interaction by making a content selection
    await self.gumband_sdk.create_event("ContentSelection", { title: "User Option 1" })

    #delay the next user selection 30 seconds
    sleep(30)
    await self.gumband_sdk.create_event("ContentSelection", { title: "User Option 2" })
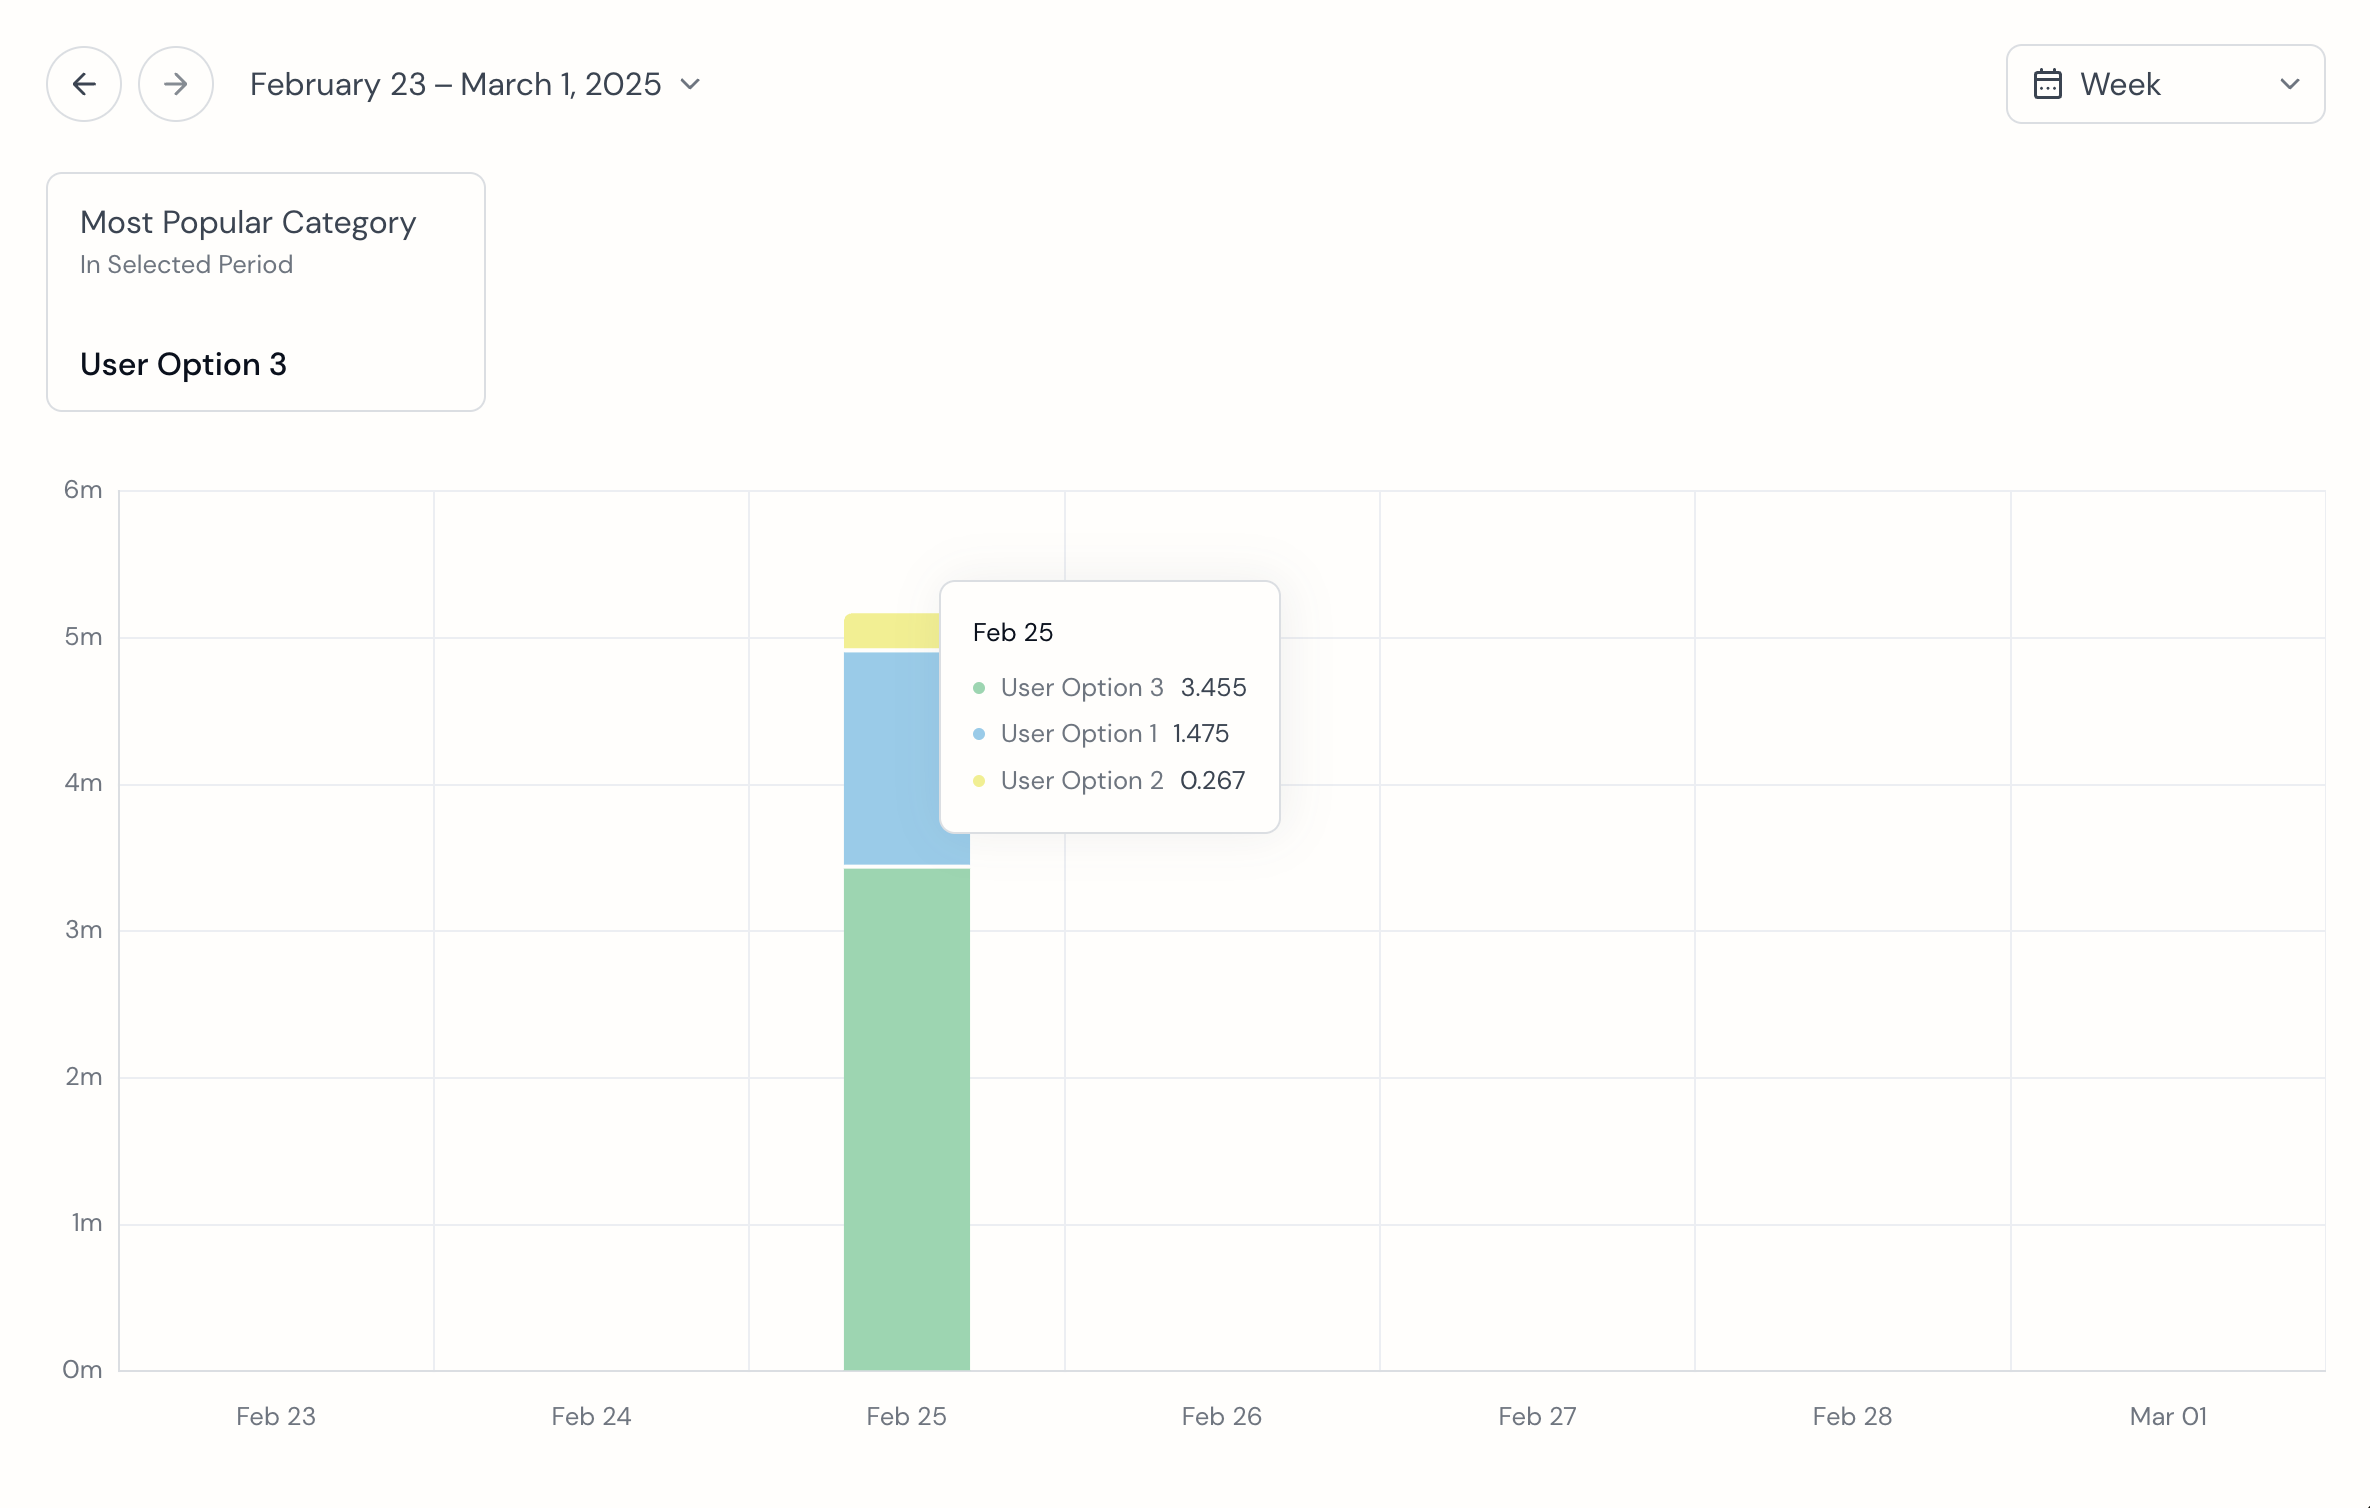 The Category Duration chart tracks the amount of time a user spends engaging with specific content. The simulated user interaction from the code snippet would result in 0.5 minutes being added to the "User Option 1" bar. The y-axis is time in minutes.